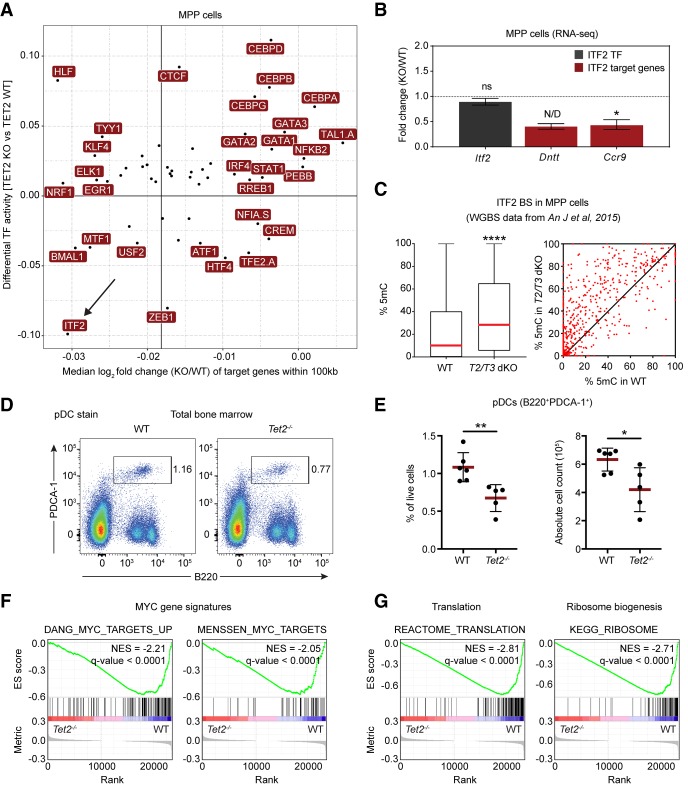
Figure 6.
Basic helix–loop–helix (bHLH) TFs are adversely affected by loss of TET2 in hematopoietic cells. (A) Correlation of changes in TF activity and target gene expression. The scatter plot shows a positive correlation (Pearson's r = 0.4; P-value < 0.005) between differential TF activity, as defined by diffTF, and the median log2 fold change of putative target genes (TF binding site within ±100 kb of the promoter region) of the same TF. The accentuated vertical line represents the median expression of all target genes used in the analysis. (B) DESeq2 expression values from RNA-seq in MPPs showing expression of Itf2 (gray) and the two validated ITF2 target genes Dntt and Ccr9 (red). Data are presented as mean ± SEM (n = 4). (ns) not significant; (N/D) not calculated due to outlier sample; (*) P < 0.05 (Q-value). (C) Box (left) and scatter plot (right) showing average 5mC changes at predicted ITF2 binding sites in wild-type and Tet2/Tet3 double knockout (T2/T3 dKO) LSK (LineagenegSca1+cKit+) cells (An et al. 2015). Box plot shows median (red line) and 25th and 75th quantile, and the scatter plot shows 5mC changes for individual ITF2 sites. Only CpG sites covered by more than 10 reads were included in the analysis. (****) P < 0.0001 (paired two-tailed Student's t-test). (D) Representative FACS plots showing the population of plasmacytoid dendritic cells (pDC) in bone marrow of aged wild-type and Tet2-deficient animals. (E) Scatter dot plots showing the percentage (left) and absolute cell count (right) of pDCs in the bone marrow of aged wild-type and Tet2-deficient animals. Line and error bars represent mean ± SD (n = 5–6). (*) P < 0.05; (**) P < 0.01 (unpaired two-tailed Student's t-test). (F) Enrichment plots from GSEA showing decreased expression of MYC target genes in Tet2-deficient MPP cells (Menssen and Hermeking 2002; Zeller et al. 2003). (G) Enrichment plots from GSEA showing decreased expression in Tet2-deficient MPPs of genes involved in ribosome biogenesis and translation (see Supplemental Table S2 for full list of gene signatures).

