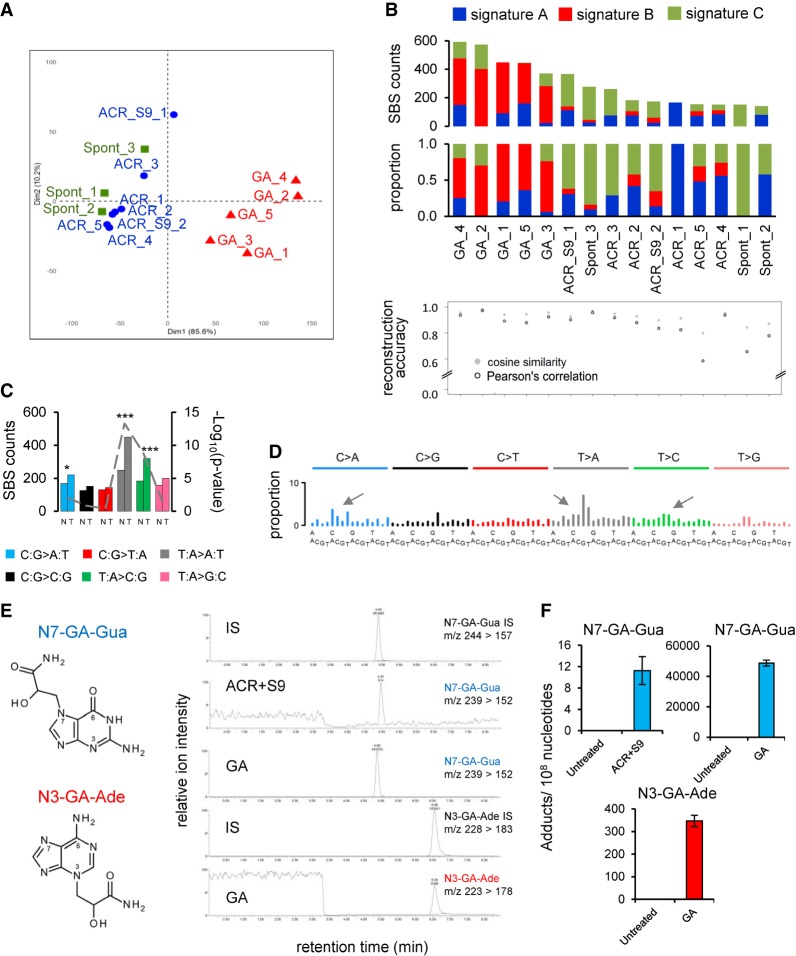
Figure 1.
Analysis of the mutation patterns derived from experimental exome sequencing data. (A) Principle component analysis (PCA) of WES data. PCA was computed using as input the mutation count matrix of the clones that immortalized spontaneously (Spont) or were derived from exposure to acrylamide (ACR) or glycidamide (GA). Each sample is plotted considering the value of the first and second principal components (Dim1 and Dim2). The percentage of variance explained by each component is indicated within brackets on each axis. Spont and ACR- and GA-exposed samples are represented by differently colored symbols. (B) Mutational signatures (sig A, sig B, and sig C), identified by NMF, and their contribution to each sample (x-axis), assigned either by absolute SBS counts or by proportion (bar graphs). The reconstruction accuracy of the identified mutational signatures in individual samples is shown in the bottom dot plot (y-axis value of 1 = 100% accuracy). (C) Transcription strand bias analysis for the six mutation types in GA-exposed clones. For each mutation type, the number of mutations occurring on the transcribed (T) and nontranscribed (N) strand is shown on the y-axis. (***) P < 10−8, (*) P < 10−2. (D) Extraction of GA signature, with arrows pointing at the enriched SBS classes. The contribution of signature 17 (T:A > G:C in 5′-NTT-3′ context), present in all clones, was decreased by performing NMF on human-TP53 knock-in (Hupki) MEF samples pooled with primary tumor samples with high levels of signature 17 (see Methods and Supplemental Methods). (E) DNA adducts analysis as determined by LC-MS/MS. (F) Levels of N7-GA-Gua adduct in ACR + S9- and GA-treated cells and N3-GA-Ade DNA adduct level in GA-treated cells compared with untreated cells yielding no adducts. The data are presented as the number of adducts in 108 nucleotides in replicated experiments (n ≥ 2).

