Figure 3.
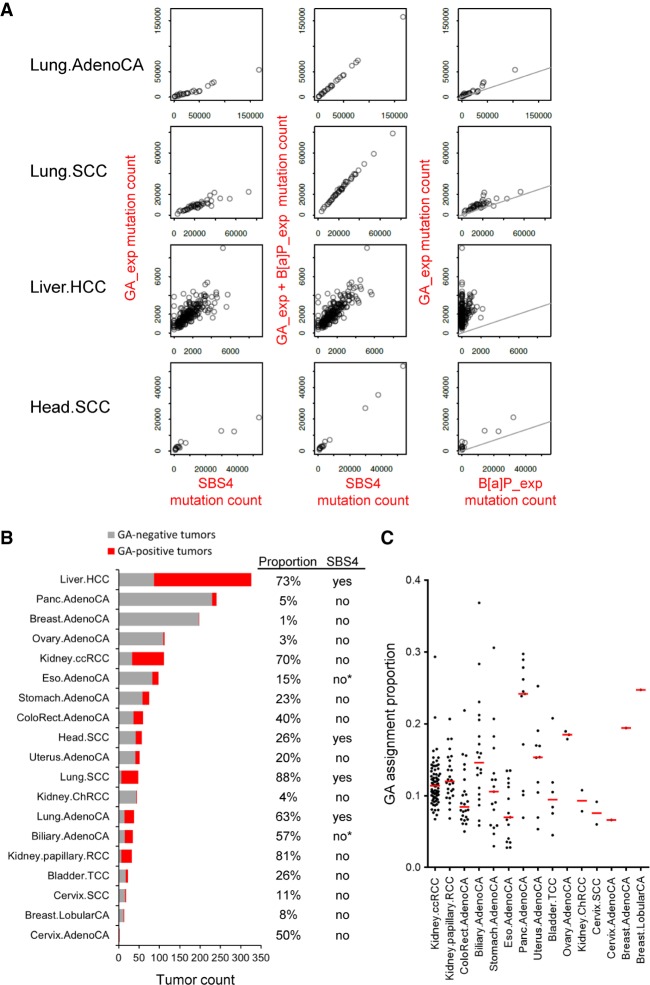
Identification of experimental GA signature in the human cancer PCAWG data sets. (A) Scatter plots of the experimental GA_exp and B[a]P_exp mutational signature assignments by mSigAct show reconstruction of tobacco-smoking signature SBS4 assignments in cancer types with SBS4 present. (Lung.AdenoCA) Lung adenocarcinoma, (Lung.SCC) lung squamous cell carcinoma, (Liver.HCC) liver hepatocellular carcinoma (Head.SCC) head squamous cell carcinoma. The combination of GA_exp and B[a]P_exp mutation counts reconstructed SBS4 mutation counts in Lung.AdenoCA and Lung.SCC and, to an extent, in Head.SCC. In liver HCCs, GA counts alone partially reconstructed SBS4 mutation counts and indicate GA_exp-positive and B[a]P_exp-negative tumors (third row, right scatter plot). The lines in GA versus B[a]P scatter plots have a slope of 0.3, reflecting the 3:1 ratio of B[a]P:GA mutation counts that reconstruct SBS4. (B) Summary of GA mutation assignment analysis of 1584 individual tumors of 19 cancer types from the PCAWG data sets. Assignments were performed using mSigAct (positivity was determined by the signature.presence.test tool at FDR < 0.05) with the PCAWG annotations of signature present in each subtype, in addition to the GA and B[a]P signatures. The tumor types manifesting or lacking SBS4 signature of tobacco smoking are labeled accordingly in the column SBS4. Asterisk denotes borderline SBS4 presence in PCAWG Billiary.AdenoCA (two of 173, 1.16%) and Eso.AdenoCA (two of 347, 0.06%). Proportion indicates percentage of GA-positive tumors within each listed cancer type. (C) The dot plot shows the proportion of mutations assigned to GA signature among other identified signatures (see Supplemental Material) in individual tumors of cancer types not showing the direct effects of tobacco smoking (i.e., lacking signature SBS4). Red horizontal lines denote median values (y-axis, 1 = 100%).

