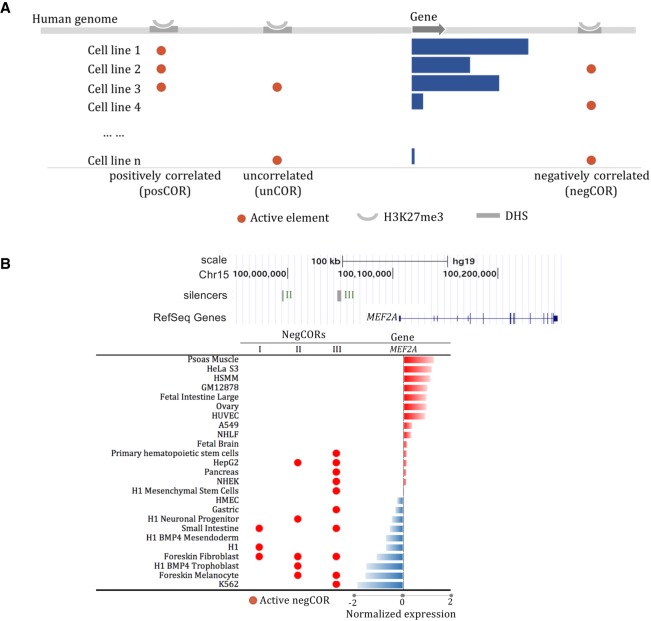
Figure 1.
Silencer identification based on correlation of cross-tissue profiles of gene expression and H3K27me3-DHS activity. (A) Multi-tissue H3K27me3-DHSs were categorized based on their correlation with the expression of proximal genes into three groups: positively correlated (posCOR); negatively correlated (negCOR); and uncorrelated (unCOR). negCORs were verified as silencers. (B) Three negCOR silencers in the locus of MEF2A.

