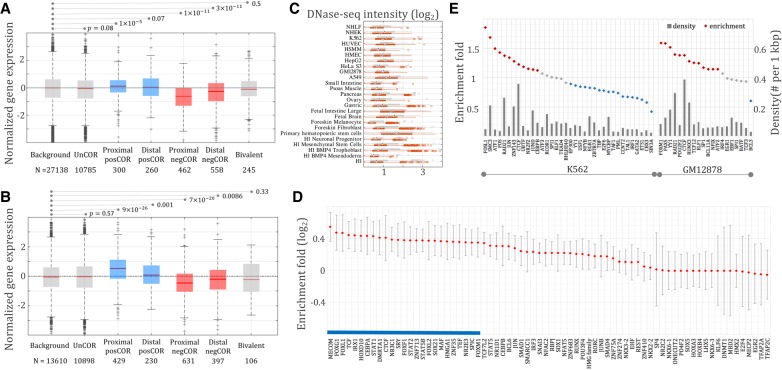
Figure 2.
Expression of genes linked to different classes of DNA sequences by Hi-C data (A) and eQTL associations (B). Background consists of all genes assayed in RNA-seq experiments. Proximal negCOR genes host negCORs in their loci, while distal negCOR genes are linked by Hi-C/eQTL to the negCOR(s) separated from them by at least one intermediate gene. Expression of the distal negCOR genes represents an independent test on the effect of negCORs. Bivalent represents the genes associated with bivalent elements reported by ChromHMM but not with either negCOR silencers or posCORs. The number below each x-axis label is the number of the associated genes. (C) DNase-seq signal intensity of negCOR silencers (red) and posCORs (gray) across cell lines. (D) Motif-based TFBS enrichment in negCOR silencers. PosCORs were used as controls for enrichment analyses. The averages and standard deviations of the enrichment values are represented by the red diamonds and the gray lines flanking the red diamonds, respectively. The blue bar identifies TFBSs ubiquitously enriched in negCOR silencers across cell lines. (E) ChIP-seq TFBS density (gray bars) and enrichment (diamonds) in K562 and GM12878 cell lines.

