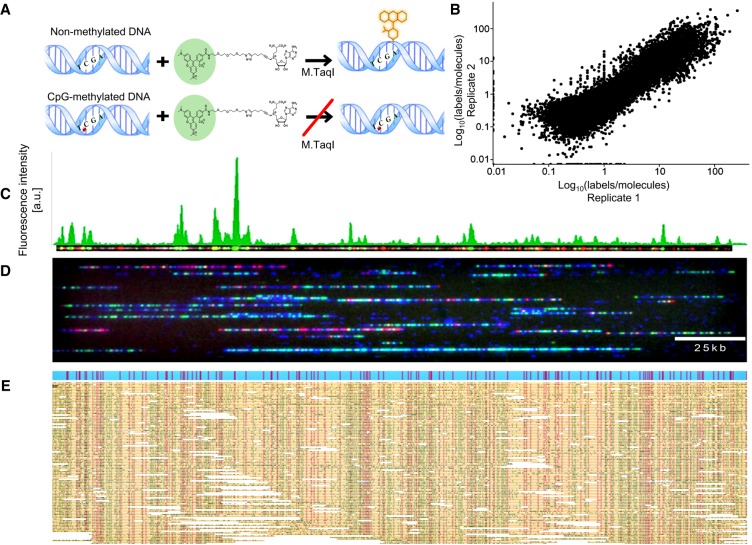
Figure 1.
ROM experimental scheme. (A, top) M.TaqI catalyzes the transfer of a TAMRA fluorophore from the cofactor AdoYnTAMRA onto the adenine residue that lies within its TCGA recognition site. (Bottom) If the CpG nested within the M.TaqI recognition site is methylated, the reaction is blocked. (B) Scatter plot comparing nonmethylation levels in two biological ROM replicates in 10-kbp windows along the human genome. (C) Representative dually labeled molecule (red dots indicate genetic barcode; green dots, methylation profile). The molecule's ROM fluorescence intensity profile is presented in green above the molecule image. (D) Representative field of view of DNA molecules (blue) fluorescently labeled in two colors and stretched in nanochannel arrays. Red dots indicate genetic labels; green dots, methylation profile. (E) Digitized representation of single molecules (yellow) aligned to an in silico generated reference (blue) according to their distinct genetic barcode (red dots). The positions of epigenetic labels (green dots) are inferred from alignment results.

