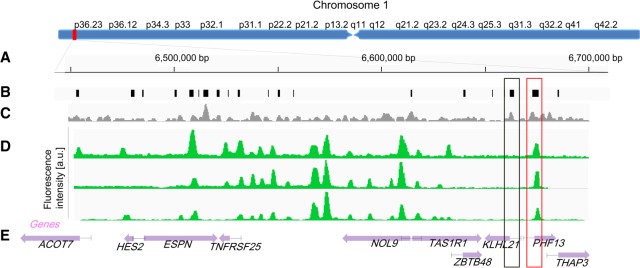
Figure 4.
Comparison of long-range methylation profiles of single molecules. (A) Global view of Chromosome 1: 6,350,000–6,670,000 (bp). (B) Locations of CpG islands across the specified region. (C) Density of M.TaqI sites across the specified region in a 1.5-kb sliding window. (D) ROM fluorescence intensity profiles of three detected molecules aligned to the specified regions based on genetic labels (P-value <10−20). (E) Gene body locations and corresponding HGNC gene symbols. Each gene is displayed as a purple arrow indicating gene orientation. (B–E) Black and red rectangles indicate methylated and nonmethylated gene promoters overlapping with CGIs, respectively.

