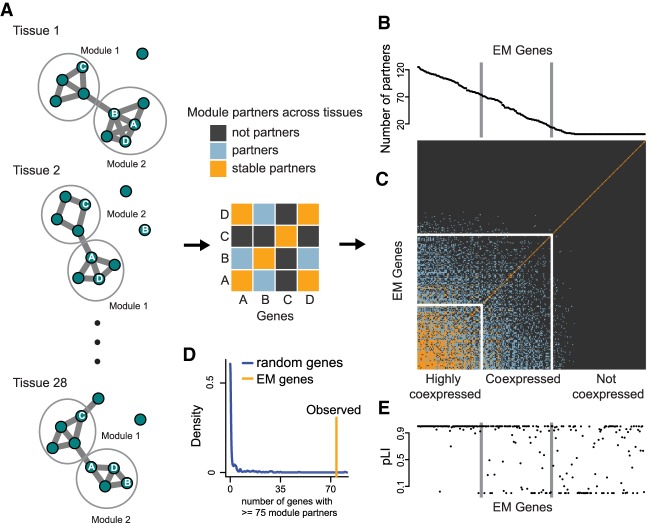
Figure 4.
A large subset of the components of the epigenetic machinery exhibit unusually high levels of coexpression. (A) Schematic illustrating our definition and identification of module partners. WGCNA was used to construct tissue-specific coexpression networks and modules for 28 tissues profiled in GTEx. We determined if two EM genes were module partners (part of the same module in 10–14 tissues) or stable module partners (part of the same module in >14 tissues). (B,C) The number of module partners for each EM gene and the module partner matrix, where rows and columns are ordered as in B. We define three groups of EM genes—highly coexpressed, coexpressed, and not coexpressed—based on their number of module partners. (D) The pLI for each EM gene, ordered by its number of module partners as in B. (E) The size of the (highly) coexpressed group of EM genes compared to 300 draws of 270 random genes, in which the random genes are selected to have a similar expression level across tissues compared to EM genes (Supplemental Fig. S10).

