Figure 3.
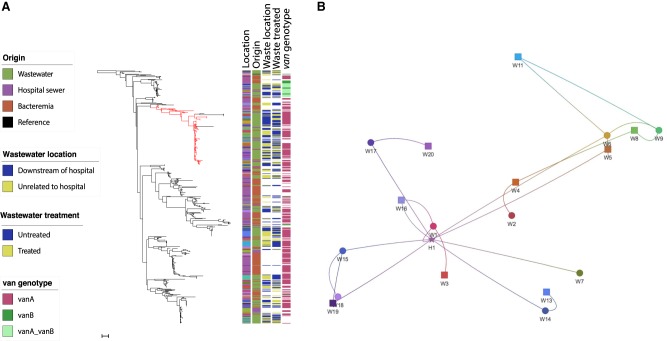
Distribution of clade A1 E. faecium and clonal expansion of dominant clusters. (A) Maximum-likelihood tree based on SNPs in the core genes of 481 clade A1 E. faecium isolates colored by geographical location in relation to receipt of hospital sewage, origin, wastewater plant location in relation to hospitals, treated or untreated wastewater, and presence of van genes. Branch leading to and including the dominant cluster is colored in red. Scale bar, ∼55 SNPs. (B) Phylogenetic network analysis showing relatedness of E. faecium based on place of origin displayed as shapes corresponding to geographical coordinates. Circles: wastewater treatment plants located downstream from hospitals; squares: wastewater treatment plants unrelated to hospital waste; star: Cambridge University Hospitals (bloodstream isolates). The edges (lines) link isolates that were very closely related (within 5 SNPs in the core genome).

