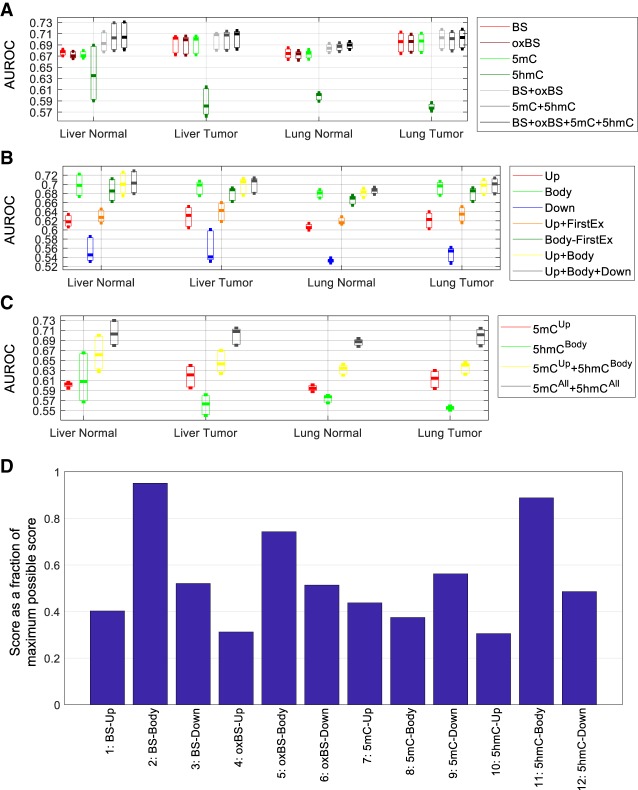
Figure 2.
Accuracy of the models for inferring expression classes based on the large data set. (A–C) Each bar represents the distribution of AUROC values across the three expression classes of the three samples in each sample group. (A) Comparison of models involving different combinations of methylation features from all associated genomic regions of the transcripts. (B) Comparison of models involving both 5mC and 5hmC levels at different combinations of genomic regions associated with each transcript. (C) Comparison of several knowledge-driven models. (D) The most useful methylation feature blocks for inferring gene expression level based on the forward-search procedure of feature selection. For each sample, the top feature block was given a score of eight, the second given a score of seven, and so on, for the top eight feature blocks. The total score of each feature block across all 12 samples is shown as a percentage of the maximum possible score of 8 × 12 = 96.

