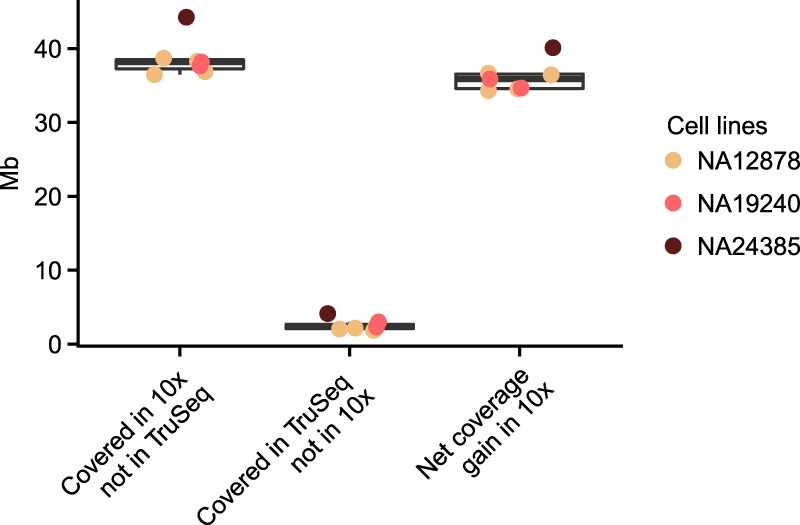
Figure 2.

Comparison of unique genome coverage by assay. The y-axis shows the amount of sequence with a coverage of ≥5 reads at MapQ ≥30. Column 1 shows amount of the genome covered by 10x Chromium where PCR-free TruSeq does not meet that metric. Column 2 shows the amount of the genome covered by PCR-free TruSeq where 10x Chromium does not meet the metric. Column 3 shows the net gain of genome sequence with high-quality alignments when using 10x Chromium versus PCR-free TruSeq. The comparison was performed on samples with matched sequence coverage (Methods).
