Figure 3.
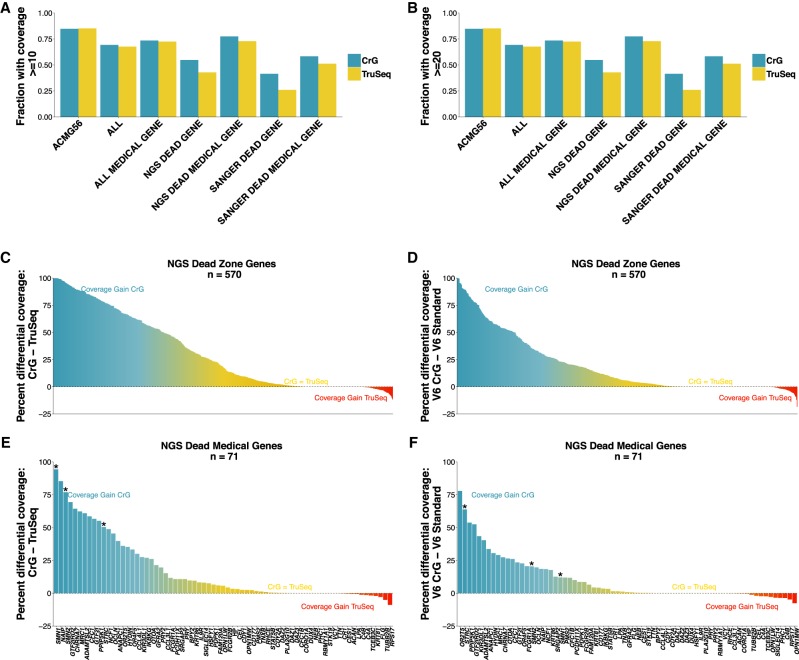
Gene finishing metrics. Gene finishing metrics for whole-genome and whole-exome sequencing across selected gene sets. Genome is shown on left, exome on right. Gene finishing is defined as the percentage of exonic bases with at least 10-fold coverage for genome (A) and at least 20× for exome (B) (Mapping quality score ≥MapQ30). (A,B) Gene finishing statistics for seven disease-relevant gene panels. Shown is the average value across all genes in each panel. Although Chromium provides a coverage advantage in all panel sets, the impact is particularly profound for “NGS Dead Zone” genes. (C–F) Net coverage differences for individual genes when comparing Chromium to PCR-free TruSeq. Each bar shows the difference between the coverage in PCR-free TruSeq from the coverage in 10x Chromium. (C,D) The 570 NGS “dead zone” genes for genome (C) and exome (D). (E,F) The graphs are limited to the list of NGS dead zone genes implicated in Mendelian disease. In C–F, the blue coloring highlights genes that are inaccessible to short-read approaches, but accessible using CrG; the yellow coloring indicates genes where CrG is equivalent to short reads or provides only modest improvement. The red coloring shows genes with a slight coverage increase in TruSeq, although these genes are typically still accessible to CrG. (*) Genes SMN1, SMN2, and STRC. The comparison was performed on samples with matched coverage (Methods).

