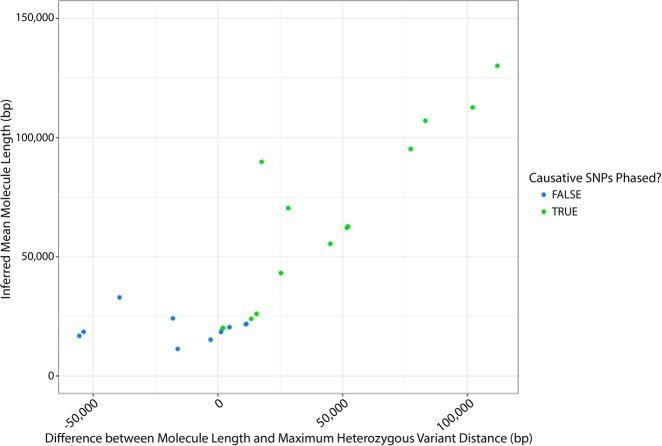
Figure 5.
Validated example of impact of molecule length on phasing (7.25 Gb). Blue dots represent samples for which the variants of interest are not phased, and green dots represent samples for which there is phasing of the variants of interest. At longer molecule lengths (>50 kb), the molecule length was always longer than the maximum distance between heterozygous SNPs in a gene, and phasing between the causative SNPs was always observed. As molecule length shortens, it becomes more likely that the maximum distance between SNPs exceeds the molecule length (reflected as a negative difference value), and phasing between the causative SNPs was never observed in these cases. When maximum distance is similar to the molecule length, causative SNPs may or may not be phased. This is likely impacted by the molecule length and variant distribution within the sample.

