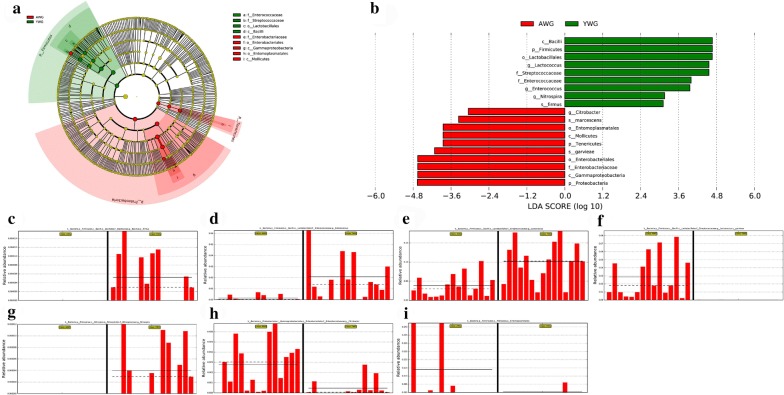
Fig. 5.
LEfSe analysis of the two groups. a Cladogram of the two groups. b LDA score histogram. The relative abundance of c Bacillus firmus, d Enterococcus, e Lactococcus, f Lactococcus garvieae, g Nitrospira, h Citrobacter and i Entomoplasmatales. Solid and dashed lines indicate mean and median, respectively. The x-axis in c–i represented the samples: AWG1-15 and YWG1-15

