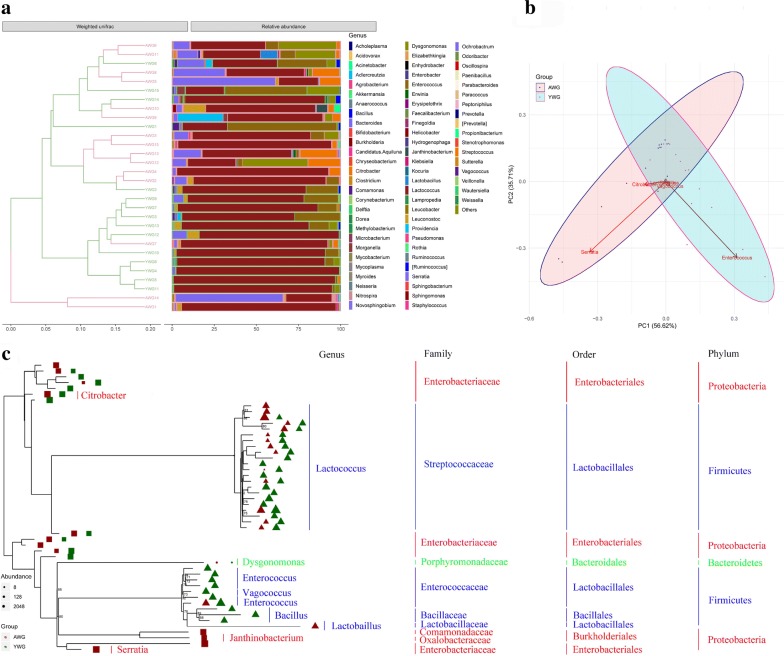
Fig. 6.
a Weighted UPGMA tree. b Beta diversity of the samples. c Maximum likelihood tree of 50 detectable OTUs (the relative abundance > 1% in the given sample). The complete 16S rRNA gene sequences of the corresponding species in the RDP database were used to construct the tree. Red indicates the OTUs in the AWG group, and green indicates the OTUs in the YWG group. Only the OTUs with significant differences (p < 0.05) in relative abundance are shown behind the branches. The size of the symbol indicates the relative abundance of OTUs

