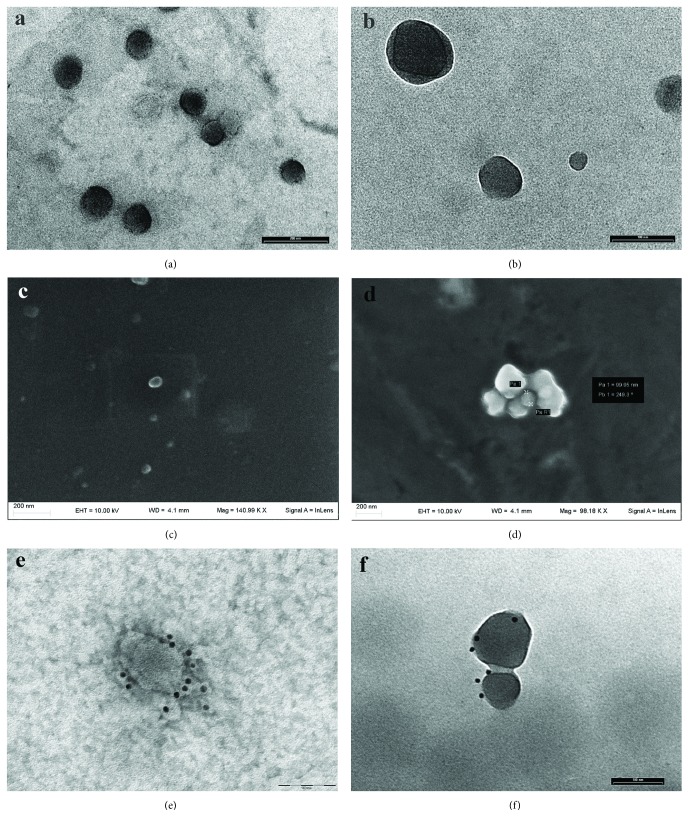
Figure 1.
Electron micrographs depicting EVs isolated by e-AdMSC supernatants. (a) Electron micrograph showing round-shaped EVs. TEM, scale bar, 200 nm. (b) High magnification micrograph showing several vesicles. TEM, scale bar, 100 nm. (c) The figure represents isolated EVs observed by SEM. Scale bar, 200 nm. (d) The figure depicts a small aggregate of EVs observed by SEM. Scale bar, 200 nm (e, f) Immunoelectron microscopy. CD90-positive EVs (e) and flotillin-1-positive EVs (f). Scale bar, 100 nm.

