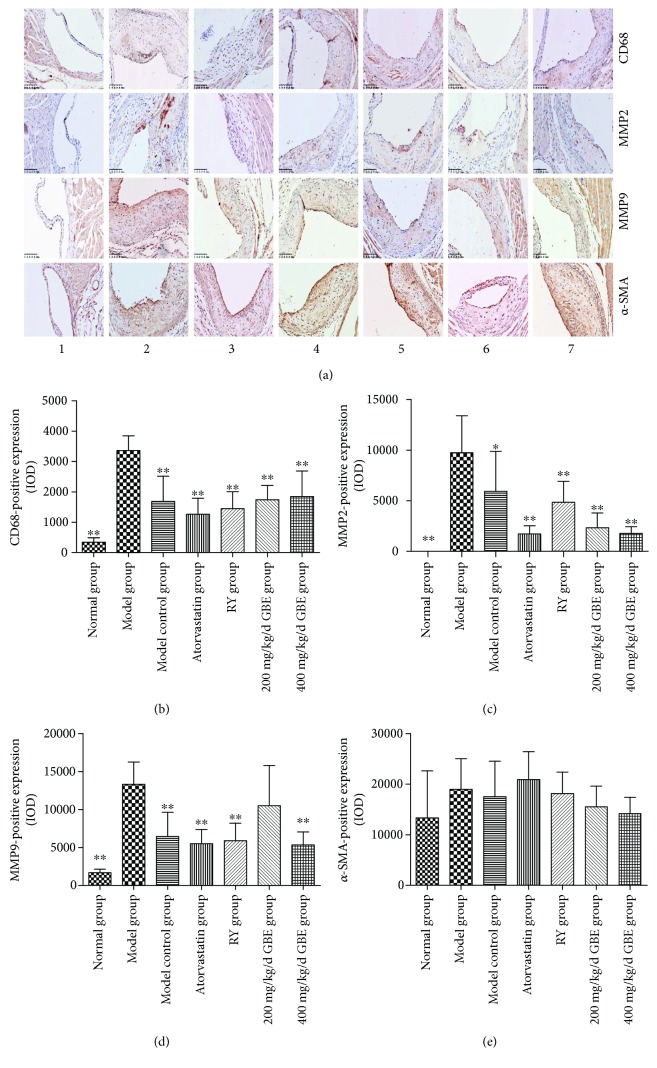
Figure 9.
Immunohistochemical staining for the expression of CD68, MMP2, MMP9 and α-SMA in the atherosclerotic plaques. ∗∗P < 0.05, ∗∗P < 0.01, compared to model group. (1) Normal group (n = 3), (2) model group (n = 5), (3) model control group (n = 5), (4) atorvastatin group (n = 5), (5) rapamycin group (n = 5), (6) 200 mg/kg/day GBE group (n = 5), and (7) 400 mg/kg/day GBE group (n = 5) (immunohistochemical staining 200x).

