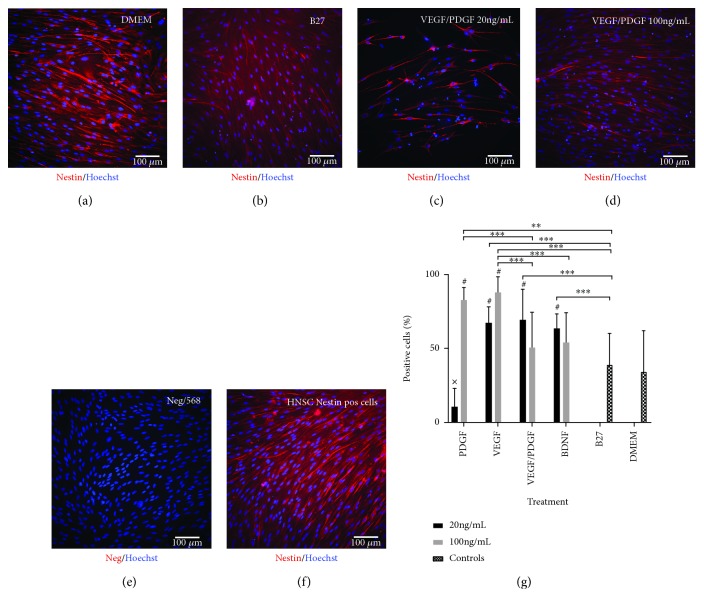
Figure 3.
Nestin expression after 14-day treatment. (a) DMEM undifferentiated control cells. (b) B27-positive differentiating control. (c) HNSC cultured with base media and 20 ng/mL of VEGF/PDGF. (d) HNSC cultured with base media and 100 ng/mL of VEGF/PDGF. (e) Negative staining control. Primary antibody omitted. (f) HNSC positive staining control. All cells stained with a primary nestin antibody and an AF568 secondary antibody (red). Nuclei stained with a Hoechst antibody (blue). (g) Nestin-positive cell percentage. Graph showing the percentage of nestin-positive cells for each growth factor treatment group at 20 ng/mL and 100 ng/mL vs. positive and negative controls after 14 days of treatment. p < 0.001; ∗p < 0.05; ∗∗p < 0.01; and ∗∗∗p < 0.001; #significantly different from DMEM (p < 0.01); xsignificantly different from all treatments except for DMEM (p < 0.001).

