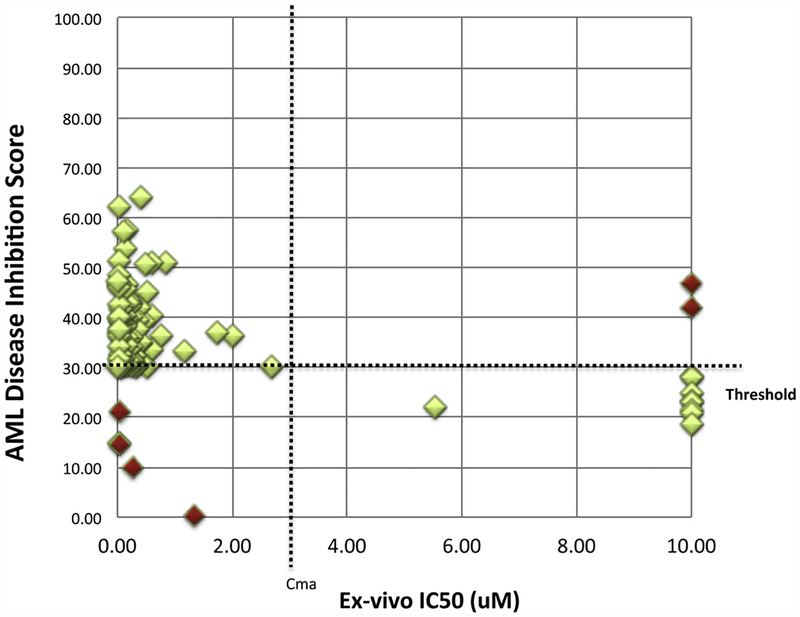
Fig. 2.
Illustration of AML disease inhibition score associations with ex vivo JQ1 IC50 values. A scatterplot representing ex vivo determined IC50 (X-axis) and virtually simulated disease inhibition scores of JQ1 (Y-axis). Cut-offs to determine sensitivity and resistance were determined empirically. For CBM response predictions (Y-axis), 30% disease inhibition was chosen as the threshold for response (horizontal threshold dotted line). A disease inhibition score > 30% is classified as a responder, or sensitive to JQ1, while a disease inhibition score < 30% is classified as a non-responder, or resistant to JQ1. For ex vivo IC50 values (X-axis), the Cmax of JQ1 was calculated from a previous study and used as the threshold for response. [11] (Vertical Cmax dotted line) IC50 < 2.7μM was considered sensitive, and IC50 > 2.7μM was considered resistant. The green diamonds indicate the responder and non-responder predictions that matched with the ex vivo response, while the red diamonds indicate false negatives and false positive predictions. Green diamonds (light) vs. red diamonds (Dark) (For interpretation of the references to colour in this figure legend, the reader is referred to the web version of this article).

