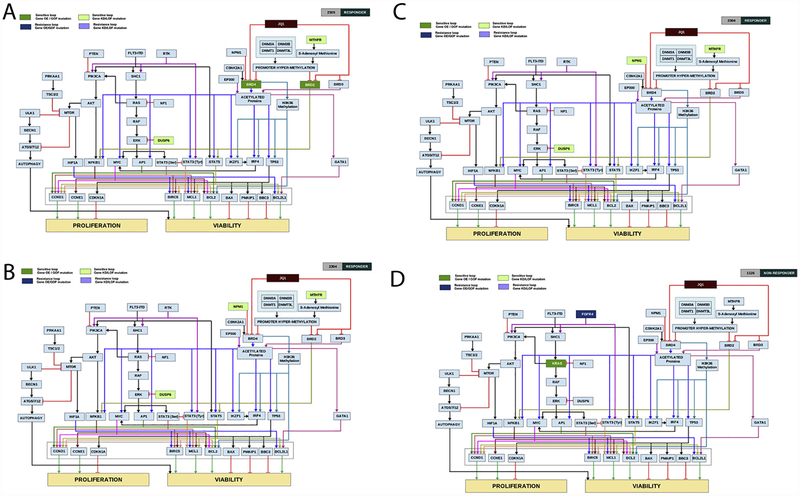
Fig. 4.
A-D: Computer-simulated patient-specific network maps and digital response to JQ1. Patient specific network maps were generated using CBM modeling. Patient 2305(A) and 2304 (B) are representative examples of profiles predicted to be sensitive to JQ1 as measured by the in-silico AML disease inhibition score. Patient 4006 (C) and 1126 (D) are representative examples of profiles predicted to be resistant to JQ1 as measured by the in-silico AML disease inhibition score. Boxes highlighted in light green represent gene mutations leading to protein loss of function or knock-down contributing to drug sensitivity. Boxes highlighted in darker green represent gene mutations leading to protein gain of function or over-expression contributing to drug sensitivity. Boxes highlighted in purple represent gene mutations leading to loss of function or knock-down of proteins contributing to drug resistance, and boxes highlighted in dark blue represent gene mutations leading to protein gain of function or over-expression contributing to drug resistance. (For interpretation of the references to colour in this figure legend, the reader is referred to the web version of this article).

