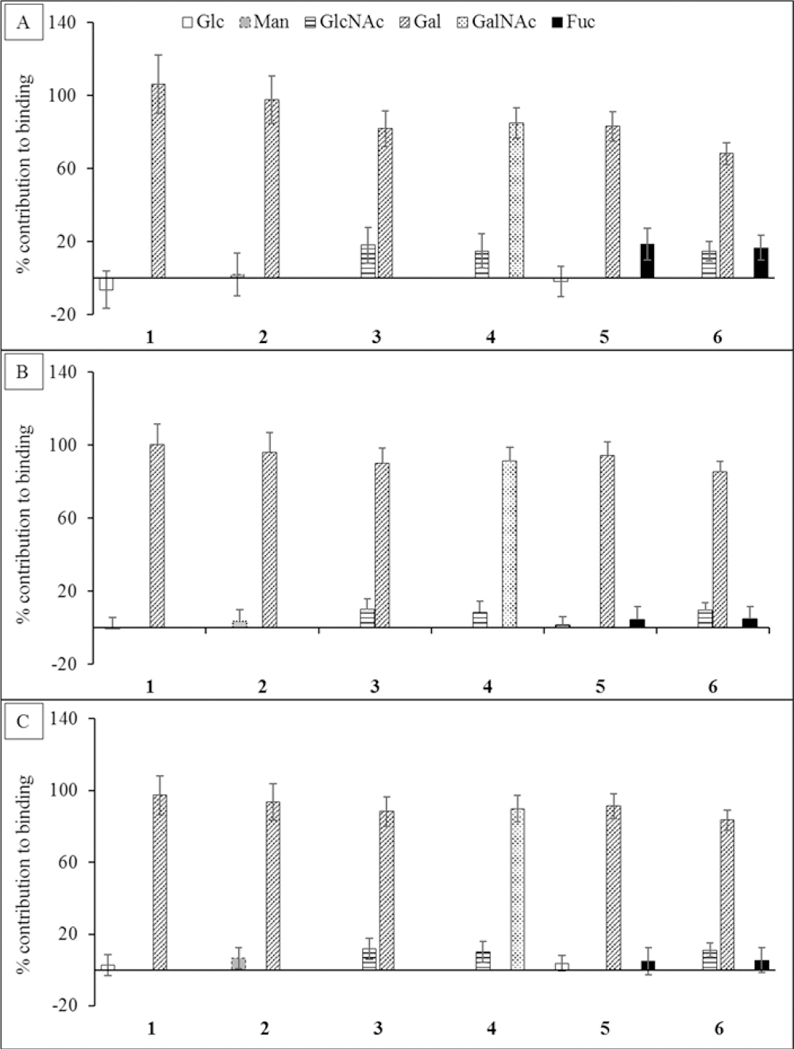
Figure 4.

Percentage contribution to the total ΔG made by each monosaccharide in each ligand. The calculations were performed using three different desolvation models: (A) GBHCT, (B) GB1OBC, and (C) GB2OBC. In each ligand the Gal or GalNAc residue contributes the most to the total affinity.
