
Figure 2.
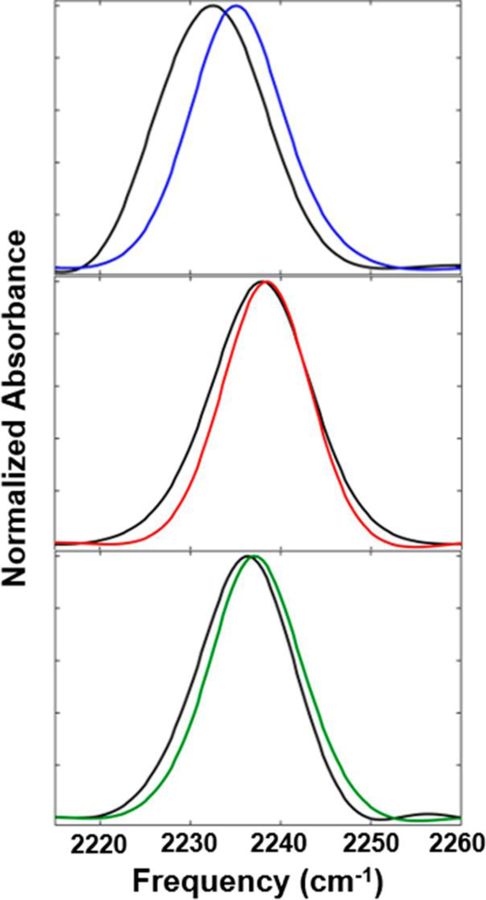
FT-IR spectra of the free Pc (colored lines) and the complex with cyt f (black lines) for CNF36 (top), CNF88 (center), and CNF90 (bottom).
Official websites use .gov
A
.gov website belongs to an official
government organization in the United States.
Secure .gov websites use HTTPS
A lock (
) or https:// means you've safely
connected to the .gov website. Share sensitive
information only on official, secure websites.
FT-IR spectra of the free Pc (colored lines) and the complex with cyt f (black lines) for CNF36 (top), CNF88 (center), and CNF90 (bottom).