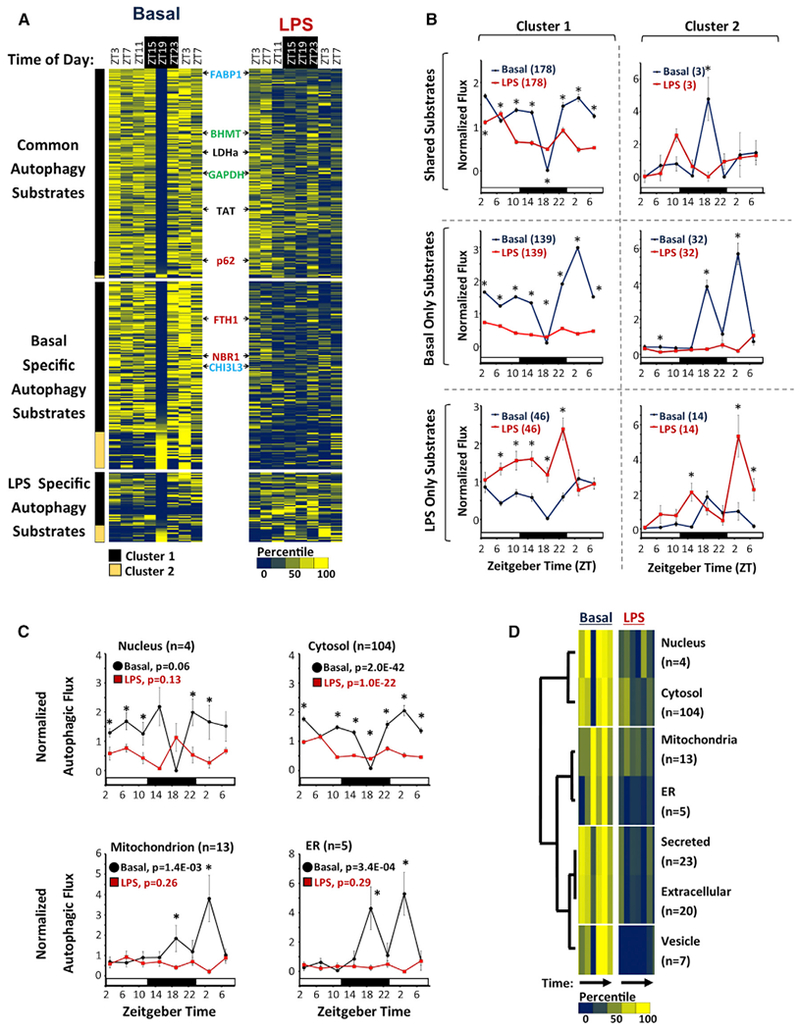
Figure 3. Circadian Analysis of the Liver Autophagic Flux.

(A) Heatmap depicting autophagic flux in mouse liver as a function of time of day and treatment (basal versus LPS). FCS values were normalized and then expressed as a percentile from the mean, with dark blue representing low turnover and yellow representing high turnover. Substrates are grouped based on whether turnover was detected in both basal and LPS-treated livers (n = 181), basal alone (n = 162), or LPS alone (n = 60). The substrates are further subdivided into 2 clusters, based on whether they have a nadir in turnover at ZT19 (cluster 1, black bar, n = 308) or not (cluster 2, light brown bar, n = 35). The positions of known selective autophagy, bulk autophagy, and chaperone-mediated autophagy (CMA) substrates are depicted in red, black, and green text, respectively. The positions of FABP1 and CHI3L3 are noted in blue text.
(B) Circadian rhythms in mean normalized autophagic flux ± SE for different groups of substrates. Black circles, basal livers; red squares, LPS-treated livers. Sample sizes are specified in parentheses. **p < 0.05 basal versus LPS (Student’s two-tailed t test).
(C) Normalized autophagic flux (mean ± SE) for basal autophagy substrates with UNIPROT annotations exclusive for the nucleus (n = 4), cytosol (n = 104), mitochondria (n = 13), and ER (n = 5). Black circles, basal livers; red squares, LPS-treated livers. The p values calculated by one-way ANOVA are provided. *p < 0.05 basal versus LPS (Student’s two-tailed t test).
(D) Hierarchal clustering analysis of autophagic flux mapping to specific subcellular compartments. Colored bars represent a heatmap of autophagic flux as a function of time of day in basal and LPS-treated livers. Low flux, dark blue bars; high flux, bright yellow bars. Sample sizes are depicted to the right.
See also Figures S3 and S4 and Data S1.
