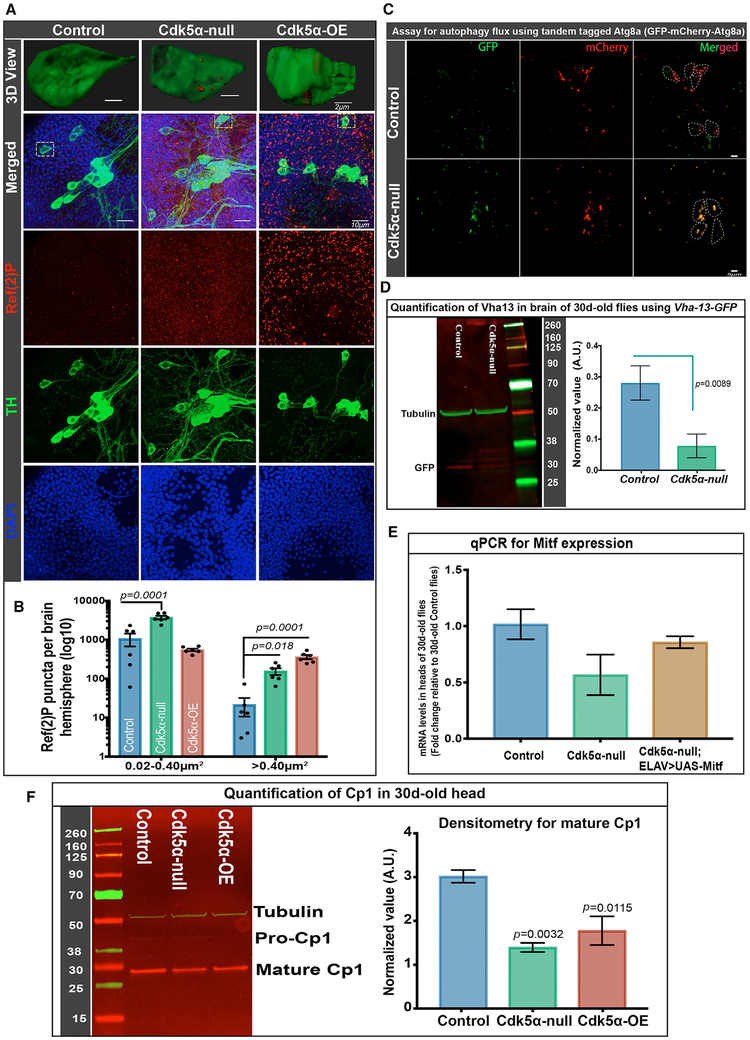
Figure 5. Altered Cdk5α Levels Reduce Autophagy Efficiency.
(A and B) Flies of the indicated genotypes were aged to 30 days, and brains were fixed, dissected, and labeled with DAPI (blue), anti-TH (green), and anti-Ref(2)P (red).
(A) Projected confocal images, including PPL1 cluster, showing separated channels and merged image, as well as a 3D surface rendering of a single TH+ cell (dotted yellow rectangle in merged image).
(B) Ref(2)P+ puncta were counted using the ImageJ (NIH) particle counting tool, and data are presented as mean ± SEM, with individual values shown. Brain region including PPL1 cluster was examined for six hemispheres per genotype, and puncta were counted in two size ranges, 0.02–0.40 μm2 and >0.40 μm2. Statistical significance was assessed by one-way ANOVA with Dunnett’s multiple correction. For a 3D view documenting the localization of Ref(2)P puncta inside the DA neuron, the 3D cropping tool of Imaris (Bitplane) was used, followed by surface rendering and manual pruning of puncta outside the DA neuron.
(C) TH-Gal4 was used to drive UAS-GFP-mCherry-Atg8a in DA neurons. Brains were dissected without fixation, and fluorescence was examined. DA neurons of control flies (w+;UAS-GFP-mCherry-Atg8a/CyO;TH-Gal4/TM6B) have mostly mCherry+ puncta, while Cdk5α null flies (w+; Cdk5α/DfC2,UAS-GFP-mCherry-Atg8a;TH-Gal4/TM6B) have mostly double-positive puncta (yellow). Six biological replicates were used for this experiment.
(D) Western immunoblot with anti-GFP antibody was used to quantify Vha13 protein in the extract of 30-day-old heads of flies of the indicated genotypes bearing a Vha-13-GFP gene trap. Left: typical immunoblot; numbers give the molecular weights of the markers. Right: quantification, displaying mean ± SEM (average of three biological replicates, normalized with anti-tubulin as loading control). Significance determined by paired t test.
(E) qRT-PCR was performed in biological triplicate, as above, to quantify Mitf expression in the RNA of the heads of the indicated genotypes. Error bars indicate SEM. UAS-Mitf was driven with a third chromosome insert of ELAV-GAL4 that has very low adult expression (BL8760).
(F) Western immunoblot (left) and quantification (right) of cysteine protease (Cp1), detected with anti-Cp1 antibody in the extract of the heads of the indicated genotypes isolated at 30 days of age. The Cp1 value presented is an average of three biological replicates, normalized with anti-tubulin as the loading control. Error bars indicate SEM. Raw intensity values from all of the trials are given in Table S4. Significance was assessed by one-way ANOVA with Dunnett’s multiple correction. The molecular weights of the markers are indicated next to the blots.

