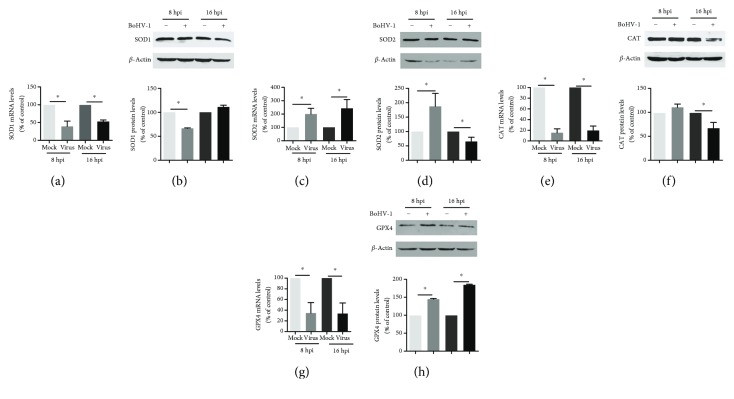
Figure 3.
The effects of BoHV-1 infection on the gene expression of antioxidant enzymes. (a, c, e, and g) The total RNA was prepared at 8 and 16 h after infection in MDBK cells, and the mRNA levels of SOD1 (a), SOD2 (c), CAT (e), and GPX4 (g) were measured by qRT-PCR. Each analysis was compared with that of uninfected control which was arbitrarily set as 100%. Data represent three independent experiments. Significance was assessed with the Student t-test (∗p < 0.05). (b, d, f, and h) MDBK cells in 60 mm dishes were mock infected or infected with BoHV-1 at an MOI of 1 for 8 and 16 h. The cell lysates were then prepared for Western blots to detect the expression of SOD1 (b), SOD2 (d), CAT (f), and GPX4 (h) using SOD1 polyclonal antibody (ABclonal, #A0274, 1 : 1000), SOD2 polyclonal antibody (ABclonal, #A1340, 1 : 1000), CAT polyclonal antibody (ABclonal, #A11780, 1 : 1000), and GPX4 polyclonal antibody (ABclonal, #A11309, 1 : 1000). The band intensity was analyzed with software ImageJ. Each analysis was compared with that of uninfected control which was arbitrarily set as 100%. Data represent two independent experiments. Significance was assessed with the Student t-test (∗p < 0.05), ns: not significant.

