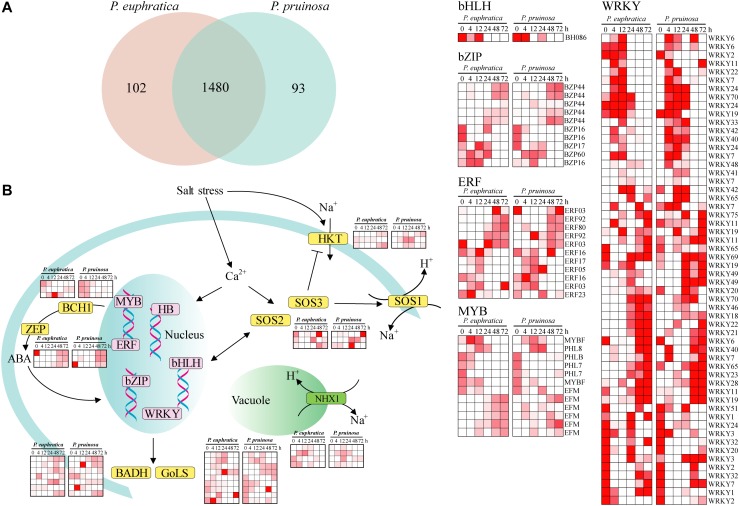
FIGURE 4.
The current known components and relationships of transcription factors related to salt response in P. euphratica and P. pruinosa. (A) Venn diagram showing overlaps between the transcription factors of P. euphratica and P. pruinosa. (B) The expanded and positively selected genes in the salt response pathways of P. euphratica and P. pruinosa (yellow). Expression of the differently expressed transcription factors of P. euphratica and P. pruinosa (pink). The heatmap was generated from hierarchical cluster analysis of genes.

