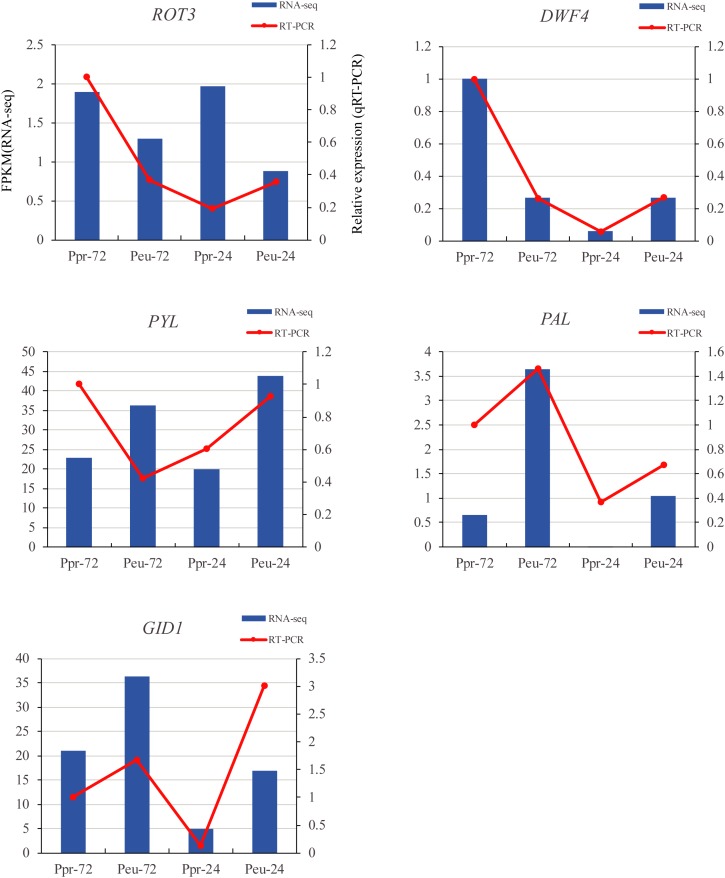
FIGURE 8.
qRT-PCR verification of five selected DEGs. We compared the RNA-seq data (blue bar) with qRT-PCR data (red lines). And we indicated the normalized expression level (FPKM) of RNA-seq on the y-axis to the left. The relative qRT-PCR expression level is shown on the y-axis to the right. CYC063 was set as the internal control. Both methods agree, showing similar gene expression trends.

