Fig. 1.
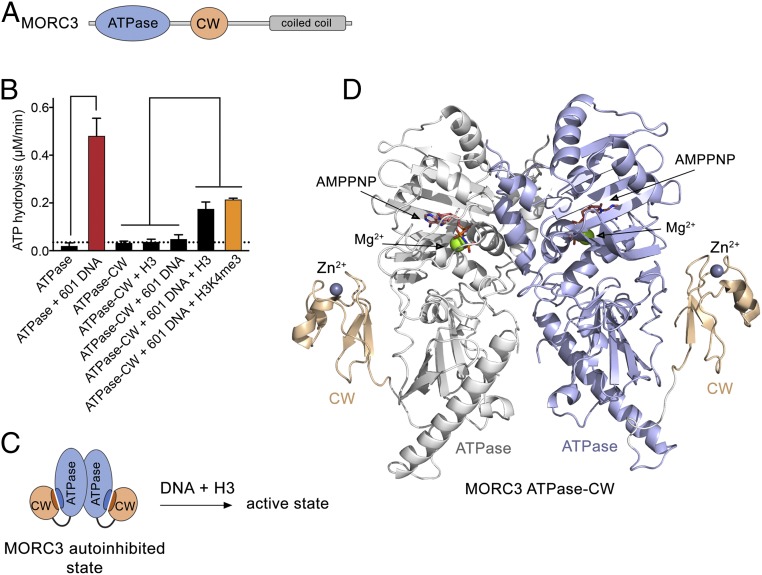
Structural basis for MORC3 autoinhibition. (A) MORC3 architecture. (B) Rates of ATP hydrolysis by the indicated domains of MORC3. Error represents SD of at least three separate experiments. To eliminate binding of the ATPase domain to bacterial DNA during sample preparation, the purified proteins were subjected to DNase treatment followed by extensive washes with high-salt buffer. We note that without the additional treatment with DNase and high salts, the ATPase domain shows a high background-level activity due to stimulation by bound bacterial DNA (4). (C) A schematic showing that DNA and H3 are required to activate the MORC3 ATPase–CW cassette. (D) The crystal structure of the dimeric MORC3 ATPase–CW/AMPPNP complex. The ATPase and CW domains are shown as a ribbon with the ATPase domain colored blue in monomer A and white in monomer B, and the CW domain colored wheat. The magnesium (green) and zinc (gray) atoms are shown as spheres. The AMPPNP molecules are in stick representation and colored dark salmon.

