Fig. 2.
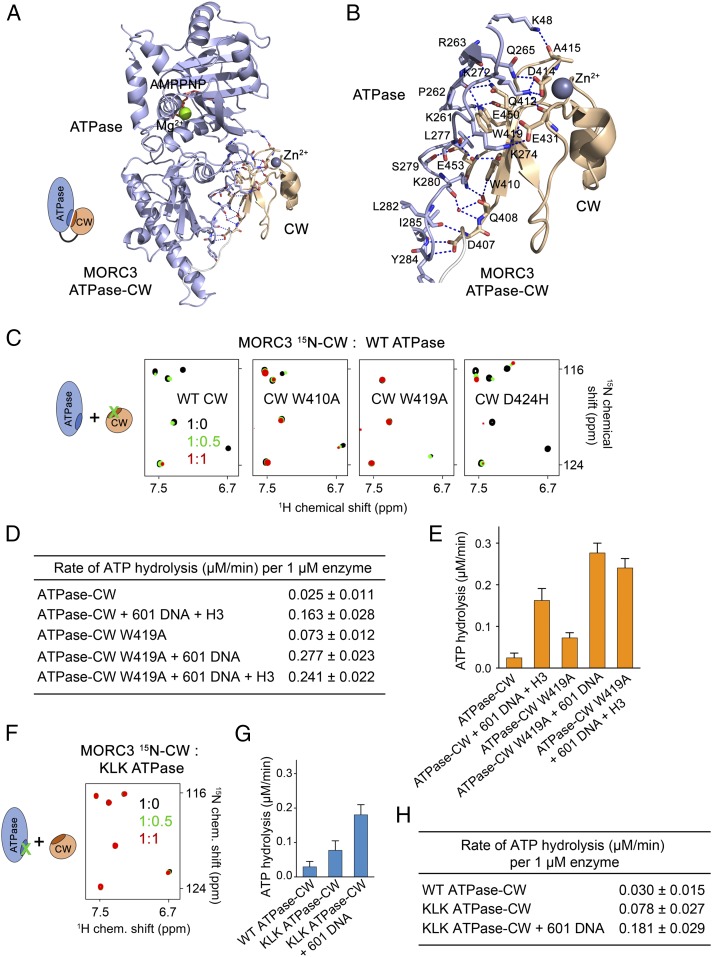
Autoinhibition is released through disrupting the ATPase:CW interface. (A) A ribbon diagram of the monomer A of ATPase–CW as in Fig. 1F. The ATPase:CW interface residues are shown in stick representation. Dashed lines indicate hydrogen bonds and salt bridges. (B) A zoomed-in view of the ATPase:CW interface shown in A. (C) Superimposed 1H,15N TROSY-HSQC spectra of the 15N-labeled WT and mutated MORC3 CW domain collected upon titration with the unlabeled ATPase domain. Spectra are color-coded according to the protein-to-protein molar ratio. A schematic (Left) specifies that the interfacial residues in CW were mutated. D424H mutant, control. (D and E) Rates of ATP hydrolysis by the MORC3 ATPase–CW cassette, WT and W419A mutant. Error represents SD of at least three separate experiments. (F) Superimposed 1H,15N TROSY-HSQC spectra of 15N-labeled MORC3 CW collected upon titration with the unlabeled K274E/L277E/K280E mutant of His-ATPase (residues 1 to 392 of MORC3). Spectra are color-coded according to the protein-to-protein molar ratio. A schematic (Left) specifies that the interfacial residues in the ATPase domain were mutated. (G and H) Rates of ATP hydrolysis by the MORC3 ATPase–CW cassette, WT and KLK mutant. Error represents SD of three separate experiments.

