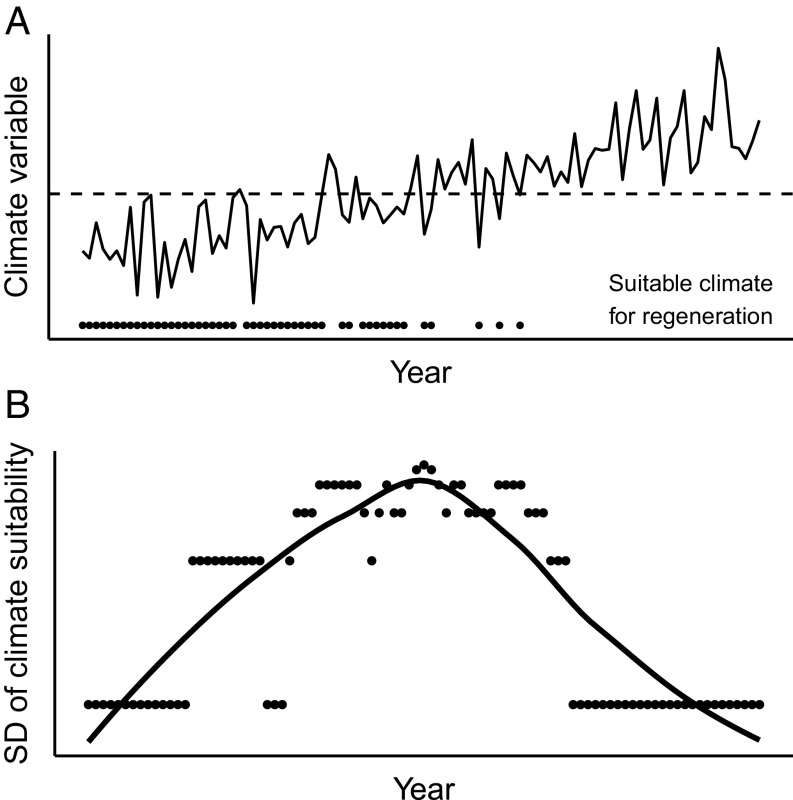
Fig. 1.
Conceptual diagram depicting a simulated hypothetical annual climate variable (e.g., mean summer temperature or vapor pressure deficit; solid line) and the corresponding expected changes to the frequency of years suitable for regeneration (dots), as mean climate conditions increase and cross a threshold for regeneration (dashed line) (A). When climate conditions are suitable for regeneration every year, other factors such as cone production may still cause episodic establishment. As climatic thresholds are approached, the SD of climate suitability for regeneration increases, shown here using a moving 10-y window and summarized with a locally weighted polynomial regression smoothing (LOESS) (B). Once a critical threshold is crossed, variability declines again, as fewer years are suitable for regeneration.

