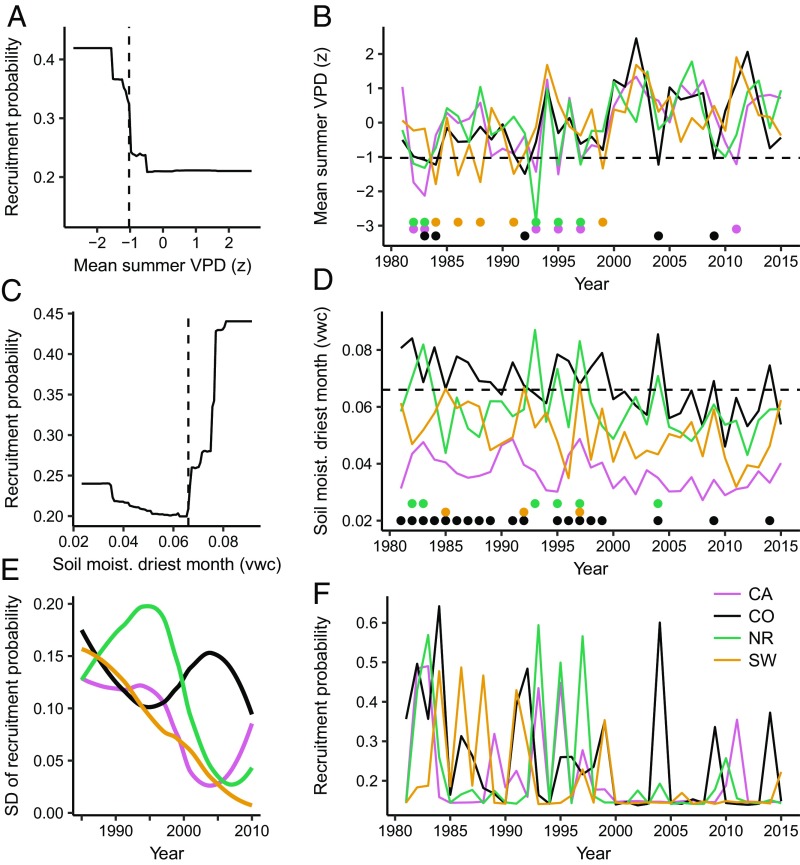
Fig. 3.
Threshold response of recruitment to annual climate and modeled annual recruitment probability for ponderosa pine. Partial dependency plots from a boosted regression tree model show the marginal effect of the two most important climate variables on annual recruitment probability, after accounting for the average effects of all other variables in the model (A and C). Annual time series of climate variables at each site averaged by region (B and D). Climate thresholds are identified with vertical (A and C) and horizontal (B and D) dashed lines. Dots below the lines in B and D represent years when that specific climate variable was suitable for regeneration. The influence of both climate variables on regeneration are summarized by the modeled annual recruitment probability (F), while holding constant time since fire (1 y), distance to seed source (50 m), and fire severity (dNBR 412). Variability in annual recruitment probability (E) is shown as the SD of recruitment probability values from F, calculated in 10-y moving windows and plotted with a LOESS. The metric vwc indicates the ratio of water volume to soil volume.

