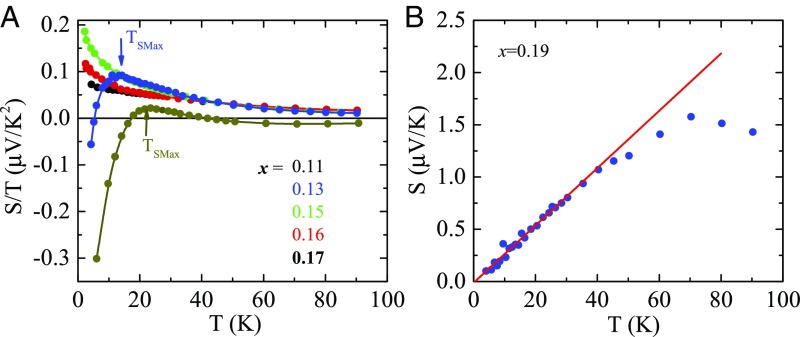
Fig. 1.
(A) Seebeck coefficient (S) of LCCO for different concentrations, plotted as versus temperature T, measured at a magnetic field of 11 T for x = 0.11–0.17. TSmax denotes the temperature below which decreases at low temperatures reaching negative values for x = 0.11 and 0.13. For x = 0.11 and 0.13 decreases below 26.5 and 13 K, respectively. For 0.15, 0.16, and 0.17 shows increasing behavior at low temperature. (B) S versus T for overdoped LCCO, x = 0.19 at zero field. The solid line is the fit to down to lowest measuring temperature, 4 K (see text).

