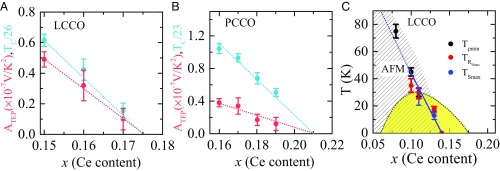
Fig. 3.
Doping dependence of ATEP (slope of the data in Fig. 2). (A and B) ATEP (red circles) and TC (divided by the SC transition temperature of the optimal doped 0.11 sample, 26 K for LCCO and 23 K for PCCO; blue circles) for different dopings of LCCO and PCCO. The error bars in TC are the standard deviation over many samples of each doping. The error bars in ATEP are a convolution of standard deviations in the values of the slopes for different temperature ranges of fitting. (C) Temperature vs. doping phase diagram of LCCO. The black line denotes the SC transition temperature as a function of concentration and the yellow region denotes the SC dome. Tρmin and TRHmax are the normal-state in-plane resistivity minima and normal-state in-plane Hall resistivity maxima, respectively (19). The solid blue line (ending at x = 0.14) represents the FSR line separating the large FS from the reconstructed FS. The nearly similar values of TRHmax, and TSmax for x = 0.11 and 0.13 samples are evidence for the FSR. The shaded regime represents AFM region (17, 18).

