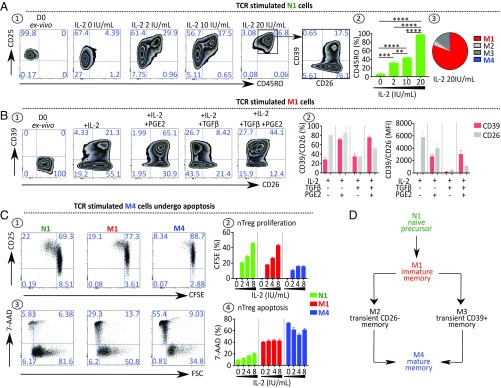
Fig. 2.
Microenvironmental context of TCR stimulation governs nTreg subset parental maturation. (A) N1 cells convert into M1 cells after ex vivo stimulation. (A1) Representative dot plots showing expression of CD25, CD45RO, CD26, and CD39 by N1 cells stimulated for 4 d, as described in Fig. 1 D5, with increasing doses of IL-2. (A2) Histograms indicating the percentage of CD45RO expressed by stimulated N1 cells (n = 3). (A3) Pie chart indicating the frequency of each memory nTreg subset in the 4-d culture of N1 cells stimulated with 20 IU/mL IL-2 (n = 4). (B) M1 cells convert into M4 cells ex vivo when stimulated as above in the presence of IL-2, TGFβ, and PGE2. (B1) Representative dot plots showing CD26 and CD39 expression by M1 cells stimulated in the presence of IL-2 with or without PGE2 (1 μM) and with or without TGFβ (5 ng/mL). (B2) Histograms indicating the percentage of stimulated M1 cells expressing CD26 and CD39 and their MFI (n = 3). (C) M4 cells represent a no-return differentiation stage. CFSE-labeled nTreg subsets were stimulated as indicated above. (C1) Representative dot plots depicting CD25 expression and CFSE dilution of 4-d cultured nTreg subsets. (C2) Histograms indicating the percentage of proliferating cells in stimulated cell cultures (n = 4). (C3 and C4) Representative dot plots (C3) and histograms (C4) showing the percentage of 7-AAD+ stimulated nTreg subsets (n = 4). (D) Diagram of the parental maturation process of the nTreg population. Data are expressed as mean ± SEM. **P < 0.01; ***P < 0.001; ****P < 0.0001.

