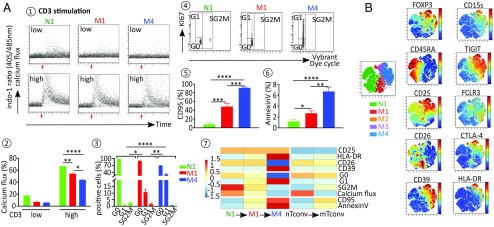
Fig. 3.
Expressions of regulatory markers are correlated with nTreg cell cycle evolution. (A) Flow cytometry analysis of biological characteristics of nTreg subsets. Calcium mobilization induced in nTreg subsets after TCR stimulation with either low (0.5 µg/mL) or high (5 µg/mL) dose of anti-CD3 Ab was measured as the ratio of indo violet to indo blue. (A1 and A2) Representative dot plot (A1) and mean ± SEM (A2) of the percentage of responding cells in each nTreg subset. (A3 and A4) nTreg subset cell cycle status (G0/G1/SG2M) as assessed by the costaining of KI-67 and DNA. Mean ± SEM (A3) and representative dot plots (A4). (A5 and A6) Expression of CD95 (A5) and Annexin V (A6) in each nTreg subset expressed as mean % ± SEM. (A7) Heatmap representation of the foregoing data. The columns represent the cell subsets N1, M1, M4, nTconv, and mTconv. The color of each row represents the fold change of the expression of the marker compared with the mean expression level; the degree of change is shown in the scale. (B) After initial gating on the CD3+CD4+FOXP3+CD127− nTreg population, the gated cells were clustered using viSNE. Cells are color-coded according to the expression levels of FOXP3, CD45RA, CD25, CD39, CD26, CD15s, TIGIT, FCLR3, CTLA4, and HLA-DR markers. *P < 0.05; **P < 0.01; ***P < 0.001; ****P < 0.0001.

