Fig. 4.
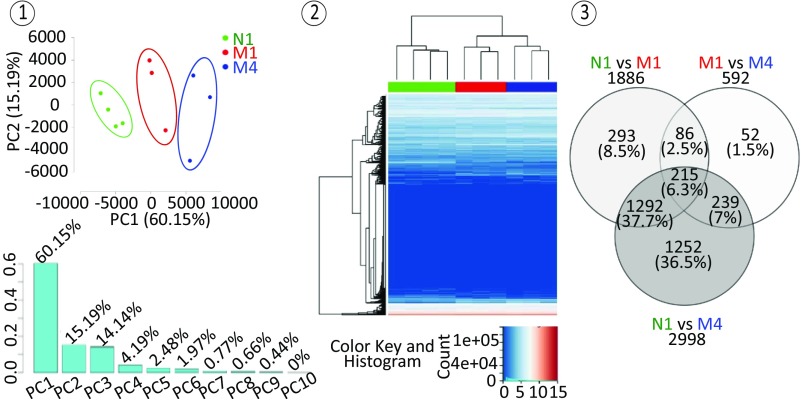
RNA sequencing analysis confirmed both nTreg subset heterogeneity and parental maturation. N1, M1, and M4 nTreg populations show distinct transcriptomic profiles. (1) Principal component analysis performed on whole transcriptome data of 10 nTreg samples obtained by RNA sequencing experiments including 25,313 genes in TPM. (2) A 2D heatmap representation of unsupervised hierarchical clustering of nTreg whole transcriptome data using log2-transformed TPM data. N1, M1, and M4 samples are labeled in green, red, and blue, respectively. (3) Venn diagram of differentially expressed genes with a greater than twofold change (Benjamini–Hochberg-adjusted P < 0.05) among N1, M1, and M4 nTreg populations.

