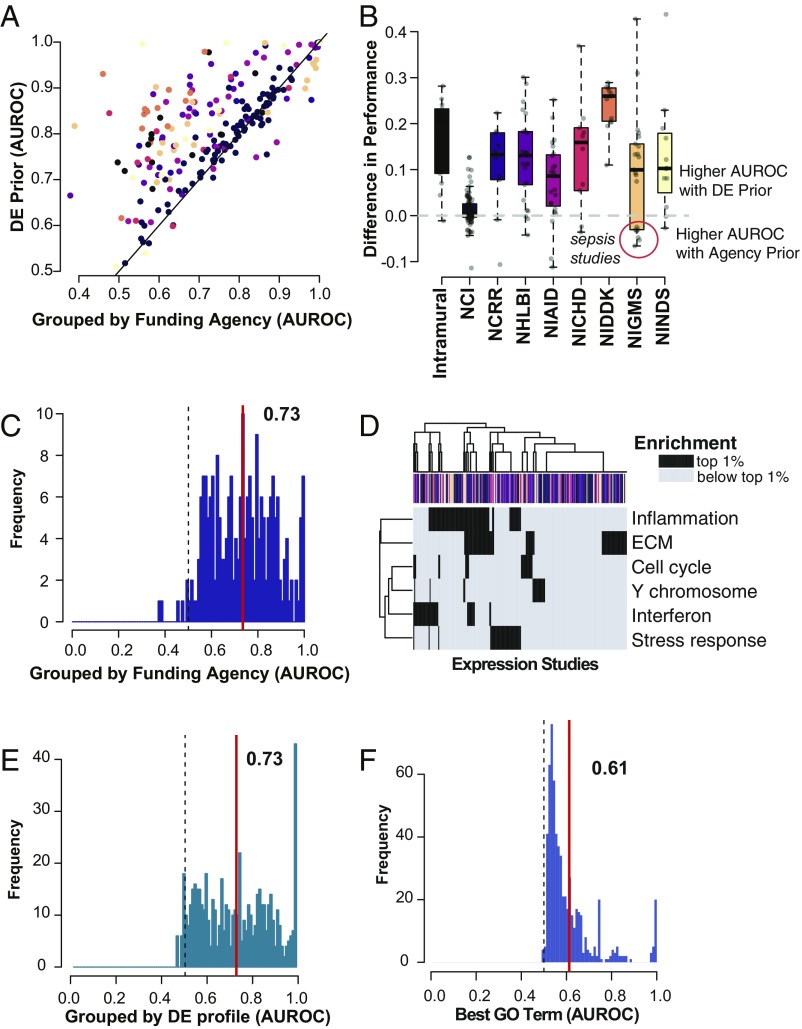
Fig. 4.
The global DE prior almost always outperforms targeted approaches to hit list prediction. (A) DE prior performance is plotted with respect to agency-specific prior performance. Each point represents an individual study, and studies are colored by their funding source, as in the boxplot in B. The identity line is shown in black. Hit lists are generally much better predicted by the global DE prior than by priors specified by funding source. (B) Difference in performance (global − agency). Boxplots show the quartiles, with whiskers extending to 1.5× the interquartile range. The majority of studies are better predicted by the DE prior, although there are a few exceptions among NIGMS funded studies (details in Dataset S1). (C) Distribution of AUROCs using funding agency-specific priors. The red line indicates the mean, and the dashed line shows the null. Mean performance is much lower than for the global prior. (D) Heatmap of enrichment for DE prior gene clusters (Fig. 3B). Rows indicate cluster labels, and columns are expression studies; colors indicate funding agency as in B. If the gene set is among the top 1% of enriched functions compared with all of the GO, the square is colored in black; otherwise, squares are gray. The majority of studies have enrichment for at least one of the clusters. Studies do not clearly group by funding agency. (E) Distribution of AUROCs using priors obtained after grouping hit lists into smaller subsets. Lines are as in C. (F) Distribution of AUROCs after selecting the maximally performing gene set from GO. Lines are as in C. NCI, National Cancer Institute; NCRR, National Center for Research Resources; NHLBI, National Heart, Lung and Blood Institute; NIAID, National Institute of Allergy and Infectious Diseases; NICHD, National Institute of Child Health and Human Development; NIDDK, National Institute of Diabetes and Digestive and Kidney Diseases; NIGMS, National Institute of General Medical Sciences; NINDS, National Institute of Neurological Disorders and Stroke.

