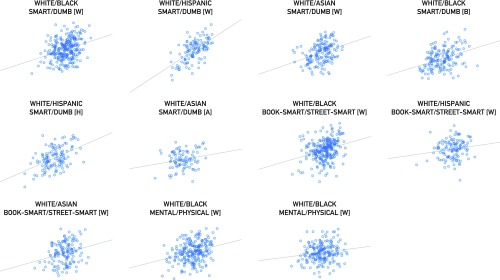
Fig. 2.
Implicit attitude–belief correlations obtained in study 1 (n = 1,942). The x axis shows IAT D scores indexing the strength of implicit attitudes, and the y axis shows IAT D scores indexing the strength of implicit beliefs. Target groups and belief attributes (e.g., white/black–smart/dumb) are indicated above each plot, with participant race in brackets (A, Asian; B, black; H, Hispanic; W, white).

