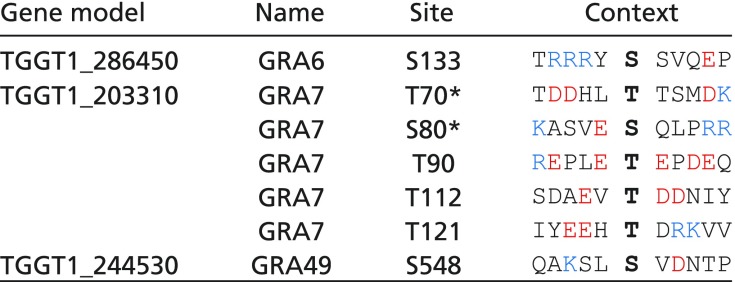
Table 2.
Phosphosites up-regulated in WNG1-deficient vacuoles
 |
Table is formatted and colored as in Table 1.
*Not significant in t test due to variability between replicates (P > 0.05) or quantified in only one type of labeling.
Phosphosites up-regulated in WNG1-deficient vacuoles
 |
Table is formatted and colored as in Table 1.
*Not significant in t test due to variability between replicates (P > 0.05) or quantified in only one type of labeling.