Fig. 1.
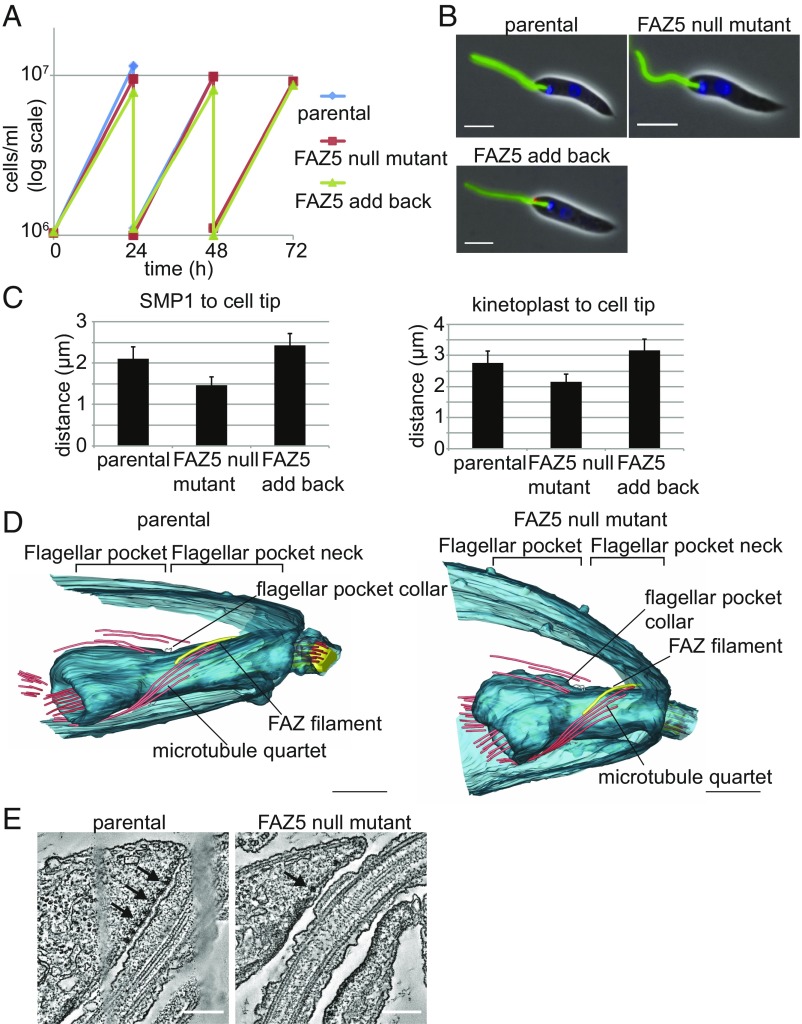
FAZ5 null mutant is able to grow but has a reduced length of flagellum within the cell body and a shorter FP. (A) Growth curves of the parental, FAZ5 null mutant, and FAZ5 add-back cells over a 72-h time period. (B) Light micrographs of parental, FAZ5 null mutant, and FAZ5 add-back cells labeled with SMP1::EGFP (green), FAZ5::mChFP add-back (red), and DNA (blue). (Scale bars, 5 μm.) (C) Measurement of flagellum length within the cell body as defined by the SMP1 signal and of the distance between the kinetoplast and the anterior cell tip for the parental, FAZ5 null mutant, and FAZ5 add-back cells. Fifty 1K1N cells were measured for each cell line, and the mean is plotted ± SD. (D) Models of FPs generated from tomograms of parental and FAZ5 KO cells. Note asymmetry of the flagellum exit point in the parental cell tomogram, which is lost in the FAZ5 null mutant tomogram. (Scale bars, 500 nm.) (E) Representative slices from the tomograms through the region of the FP neck, where flagellum attachment occurs. Electron-dense junctions connecting the membranes are clearly seen in the parental cells (arrows); however, in the FAZ5 KO cells (arrow), only a few electron-dense complexes are present, which are not associated with membrane connections. (Scale bars, 200 nm.) (Also refer to SI Appendix, Fig. S1.)

