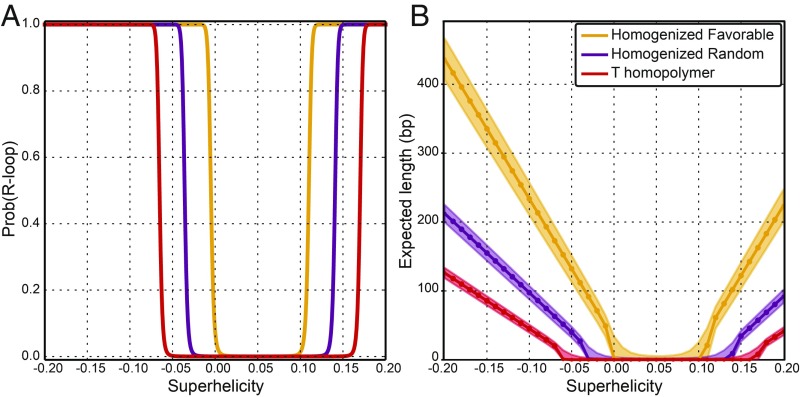
Fig. 2.
(A) The probability that an R-loop occurs on three distinct homogenized DNA sequences is graphed as a function of the DNA template superhelix density σ. (B) The ensemble average lengths expected for R-loops formed on three distinct DNA sequences are graphed as a function of σ. The shaded areas represent one standard deviation (SD) from the mean.

