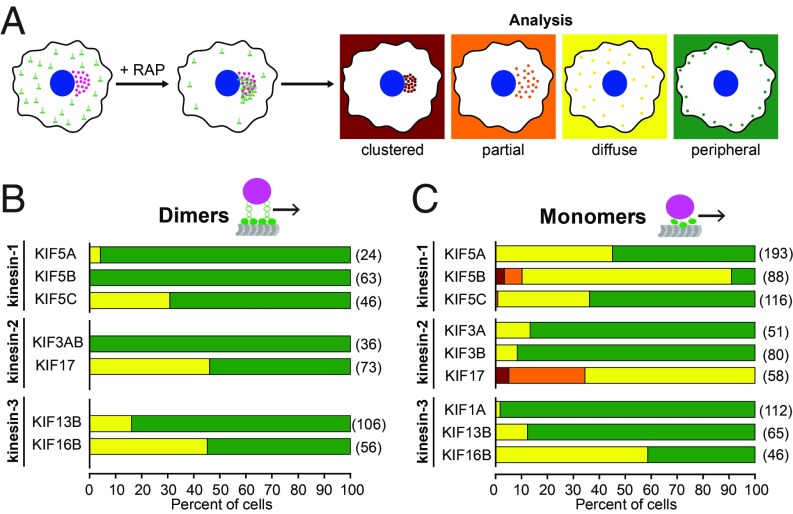
Fig. 3.
Quantification of peroxisome dispersion. (A) Schematic of classification system. The peroxisome distribution in individual cells was classified as clustered (red), partially dispersed (orange), diffuse (yellow), or peripheral (green). (B and C) Quantification of the proportion of cells in each peroxisome distribution category for cells expressing (B) dimeric or (C) monomeric versions of the indicated kinesin motors. The numbers in parentheses to the right of each bar indicate the number of cells counted across three independent experiments.

