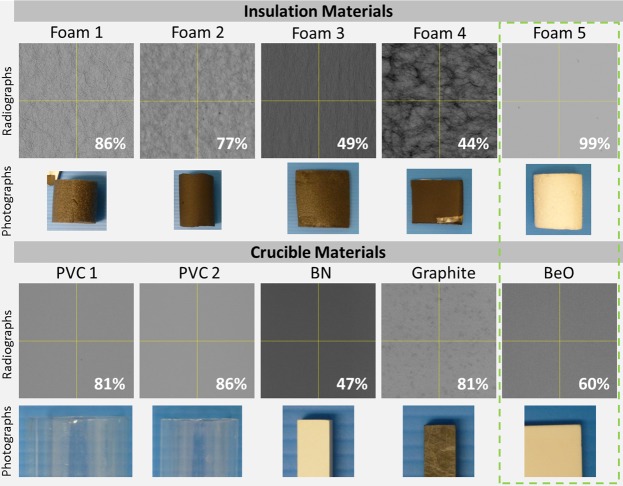
Fig. 1.
Material testing: five different insulating foams (see photographs in 2nd row) and five materials (depicted in the photographs of the 4th row) that could be used as sample holders were tested for their individual radiolucency. All radiographs of the materials were acquired at 45 kV, 350 µA, 500-ms exposure, and a gain of 24 dB. The X-ray transmission is indicated for each material as a percent of air. The green dashed box indicates the final material combination used for the cold stage with a combined transmission of 59%. Images highlight the difference in absorption levels and patterns generated by inhomogenous particle distribution in the different materials.

