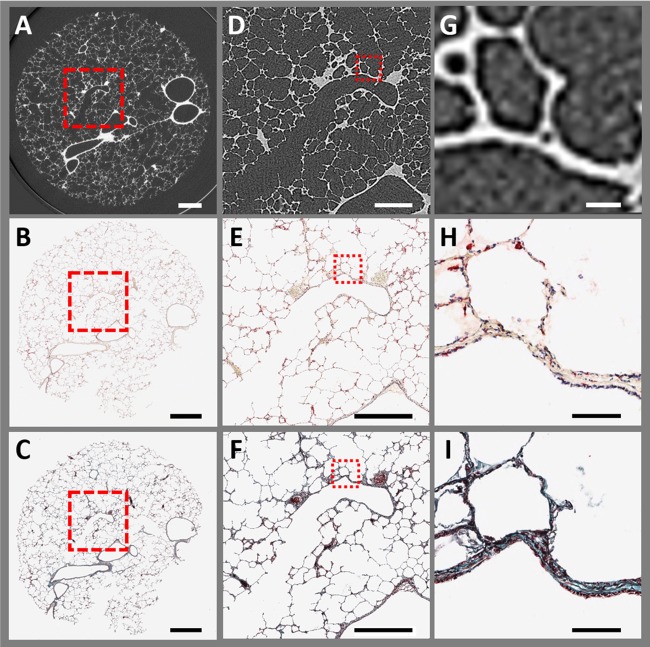
Fig. 3.
Comparison of frozen micro-CT image with matched histological sections: A–C: large field of view of a representative micro-CT image at a pixel size of 11 µm (A) and ×1 magnifications of the matched histological serial sections stained with CD68+ (B) and Mason’s trichrome (C). Micro-CT as well as histology clearly show airways, blood vessels, and alveoli. Rigid 3D image registration was performed to match the micro-CT scan with the histological sections. During tissue processing, a small part of the histological section (lower right corner) detached from the section. The red highlighted areas indicate the location of magnified areas. D–F: magnification of the region of interest centered on a terminal bronchiole. G–I: further magnified images of the bronchiolar wall and alveolar structure. The stained histological sections (×10 magnification) show a greater level of detail than the micro-CT because of the higher optical magnification vs. digital zooming into the micro-CT image. (Scale bar sizes: A–C, 2 mm; D–F, 1 mm; and G–I, 100 µm).

