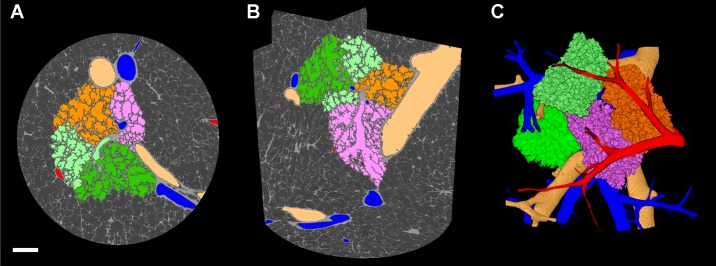
Fig. 4.
Image segmentation of parenchymal components in a scan of a frozen tissue sample. A: micro-CT image with segmentation overlays of airways (beige), arteries (blue), veins (red), and multiple acini (orange, light green, dark green, and pink; 2-mm scale bar). B: three-plane orthogonal view of micro-CT scan highlighting segmentations of parenchymal components using the same color scheme. C: three-dimensional reconstruction of the segmented components enables the visualization of the complex parenchymal structure. A 3D animated video of B and C is available online in the Supplemental Video.

