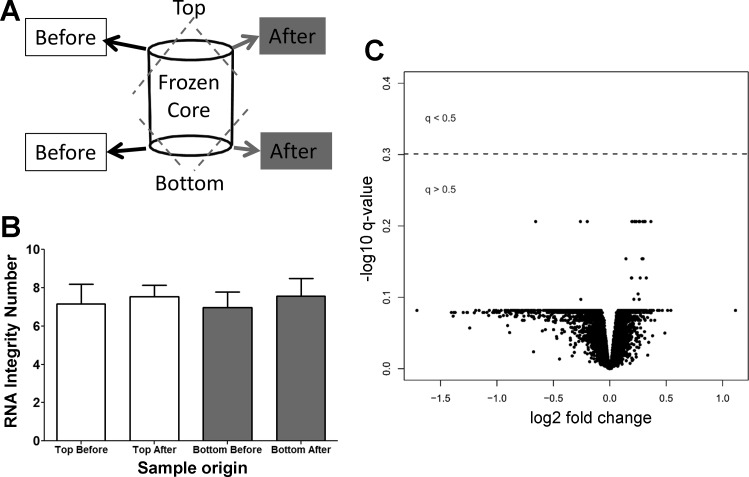
Fig. 5.
RNA integrity testing and gene expression comparison. A: four tissue samples were taken from three test samples for RNA integrity test. Two samples were taken before scanning in the cryostage, and two samples were taken afterward. B: there was no significant difference in the RNA integrity before and after the scan and between the top and bottom of the samples. Additionally, the gene expression was measured in 16 paired tissue samples, of which 8 were scanned frozen with the micro-CT scanner while the adjacent samples were not scanned. C: there were no gene expression profiles associated with micro-CT exposure (q < 0.5). Fold change was calculated using the “limma” package and represents the mean difference of the log 2-transformed expression profiles between the micro-CT-exposed and unexposed groups for each gene. P values were corrected by the Benjamini-Hochberg method, log 10 transformed and multiplied by −1 so that the most significant genes are represented at the top of the plot.

