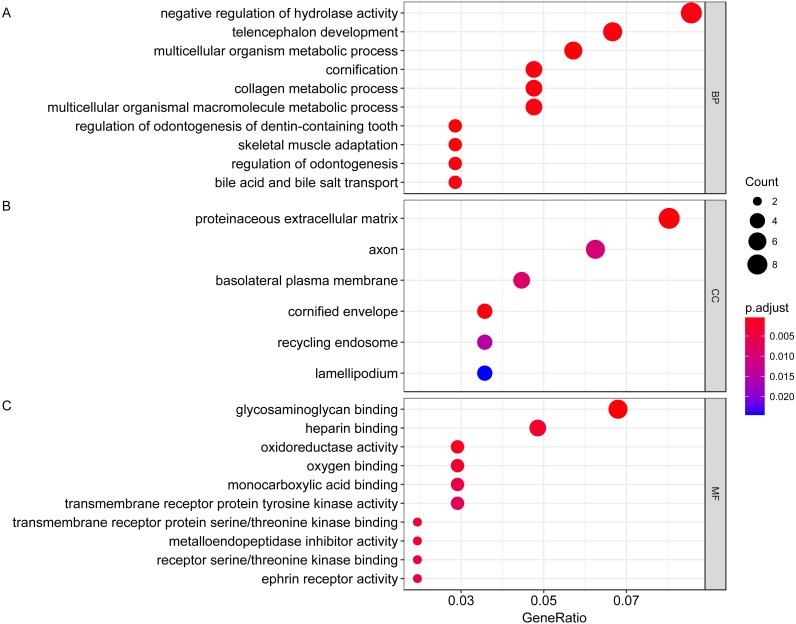
Figure 2. Gene ontology analysis of differentially expressed genes associated with response of esophageal squamous cell carcinomas to neoadjuvant chemoradiotherapy.
A total of 145 mRNAs were chosen for GO analysis for biological process, cellular component and molecular function. The size of circle represented the gene counts in go terms, the colour represented the p-value of go terms. (A) biological process. (B) cellular component. (C) molecular function.

