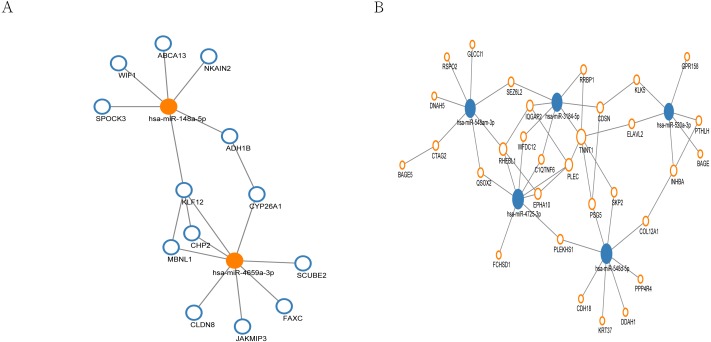
Figure 5. MiRNA regulation network associated with response of esophageal squamous cell carcinomas to neoadjuvant chemoradiotherapy.
The size of the circle in the network represents the number of connections. pink represents high expression, blue represents low expression. The fill color represents mRNA. Outer frame color represents miRNA. (A) 13 genes were regulated by two highly expressed hub miRNAs. (B) 31 genes were regulated by the 5 low expressed hub miRNAs.

