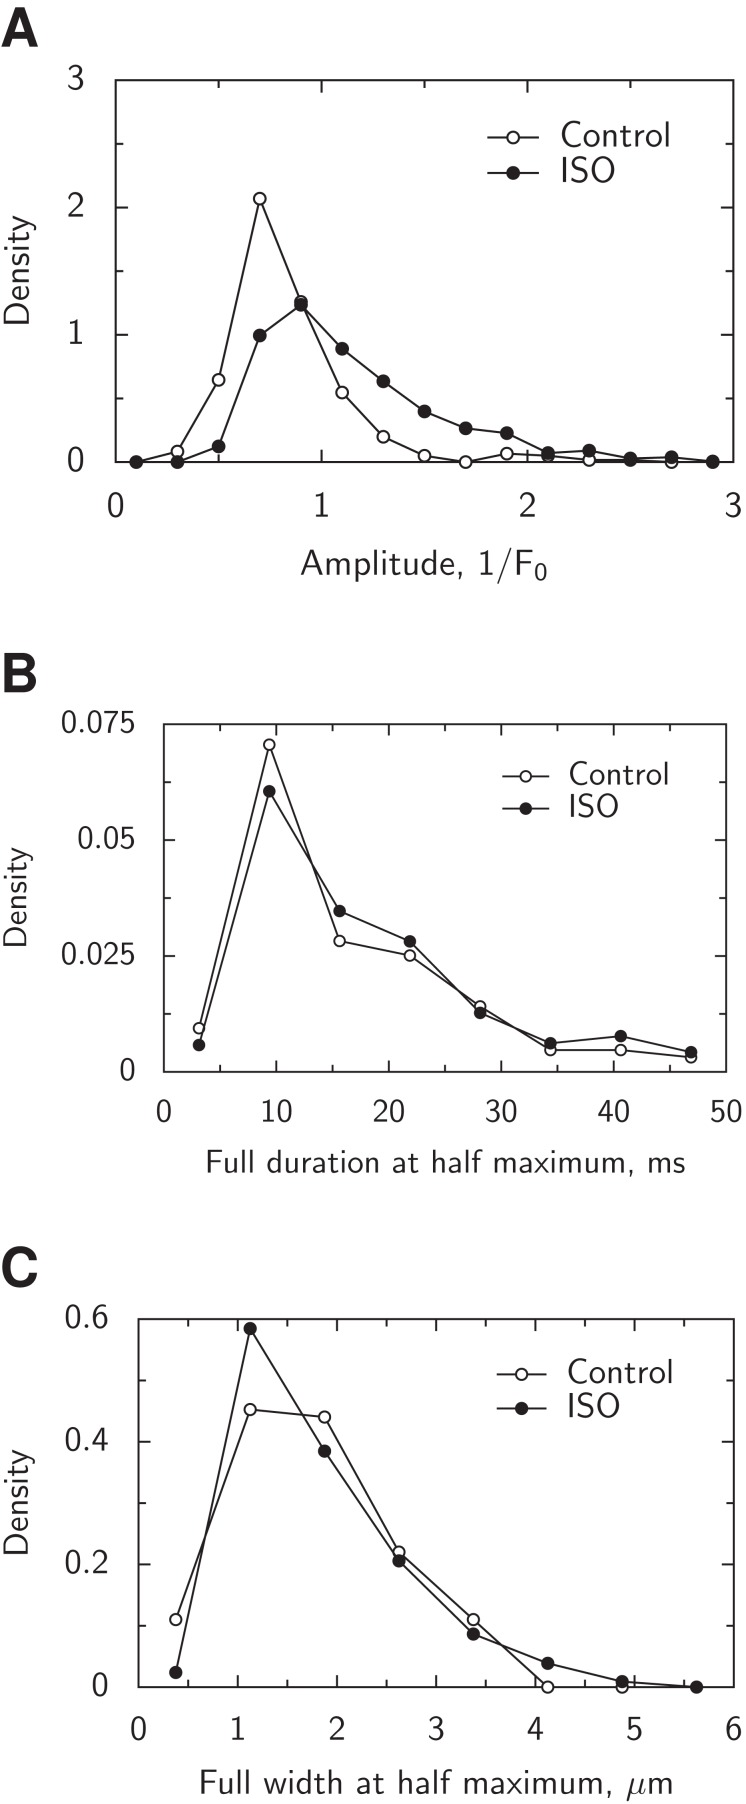
Figure 11. Analysis of spark distribution shown through probability density functions.
(A) Distribution of spark amplitudes in control and the presence of ISO. Notice the shift of the probability density function towards larger amplitudes in the presence of ISO. (B) Distribution of full duration at half maximum for sparks with the amplitudes in the range from 0.8 × F0 to 1.2 × F0. (C) Distribution of full width at half maximum for sparks with the amplitudes in the range from 0.8 × F0 to 1.2 × F0. Note that the temporal and spatial properties for the sparks with the same amplitude were similar in control and the presence of ISO.

