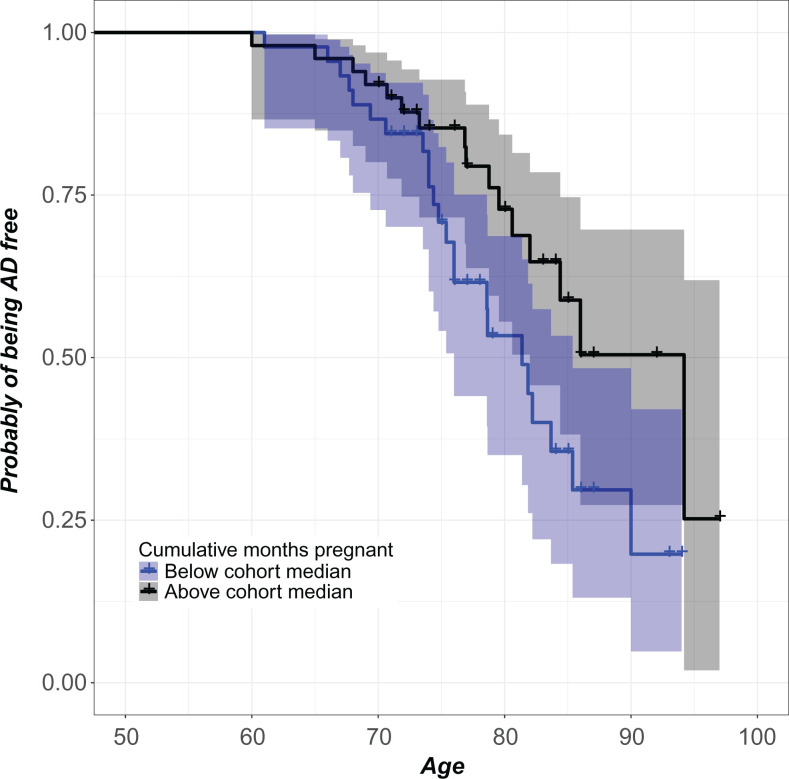
Figure 1.
Women with more cumulative months pregnant had lower AD risk. For each age, the plot reports the covariate-adjusted probability of being AD-free for women with total lifetime number of months pregnant below the cohort median (lower curve) and above the cohort median (upper curve). Pointwise 95% confidence bands are also shown. The purpose of this plot is to give a visual sense of the magnitude of the effect by dichotomizing the number of cumulative months pregnant variable. Cox regression of the reliance of AD risk on median-split dichotomous characterization of cumulative months pregnant demonstrates that women above the cohort median exhibit 37.01% lower AD risk compared with women below the cohort median (β = −.99, exp(β) = .37, se(β) = .40, P = .01, 95% CI = 0.17-0.81). The Cox model reported in Table 2 represents a more meaningful analysis by utilizing the continuous cumulative months pregnant variable. AD indicates Alzheimer’s disease; CI, confidence interval.

